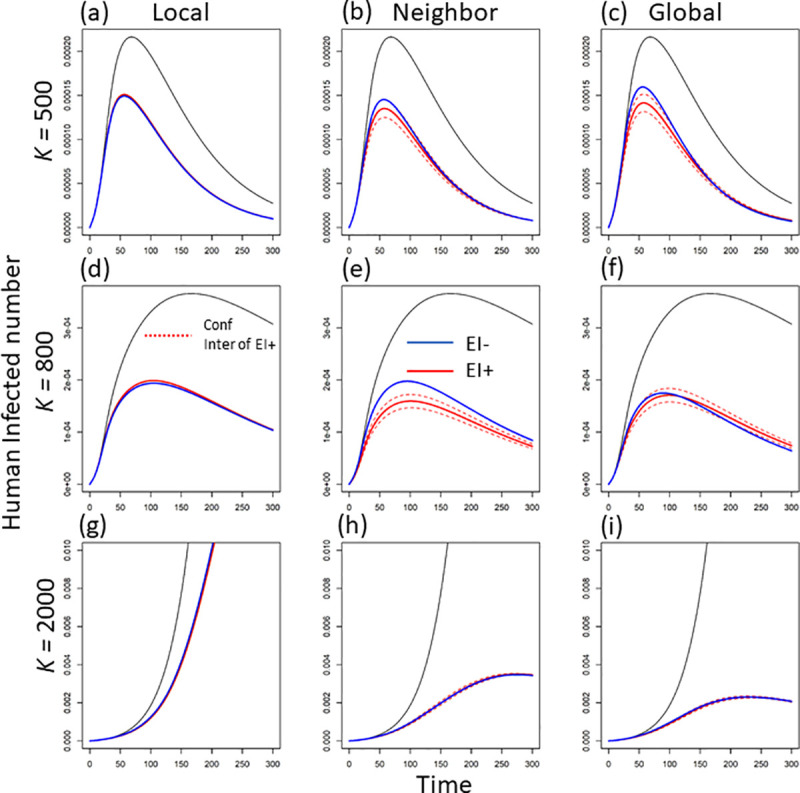
Fig 3. The dynamics of human infections (unit: no.) per patch under three levels of mosquito breeding capacity (e.g., K = 500, 800 and 2000) and three scales of disease information (i.e., local, regional, and global scale).

Here we exclude the patch where disease starts to get the average infected human number in one patch. The blue lines indicate the dynamic in the absence of early intervention, while the red lines are the dynamics in the presence of early intervention (the dashed red lines are the 95% confidence interval (CI)).
