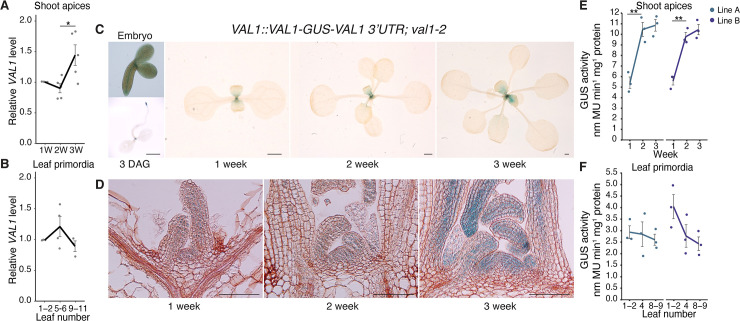
Fig 6. VAL1 is expressed throughout vegetative development.
(A, B) qRT-PCR analyses of gene expression. (A) Shoot apices with leaf primordia (LP) ≥ 1mm removed at 1, 2 and 3 weeks. (B) Isolated LP 0.5-1mm in size. (C-F) Analyses of a VAL1-GUS translational fusion. (C) Expression in whole plants, scale bars = 1mm. (D) Expression in shoot apices following wax sectioning, scale bars = 0.1mm. (E, F) VAL1 levels quantified by MUG assay in two independent homozygous T3 lines. (A, B, E, F) Each data point represents a biological replicate and is the average of three technical replicates. Lines represent the mean and grey bars mean±s.e.m. Asterisks represent significant differences between two continuous time points, calculated by an unpaired two-tailed t-test (* P < 0.05; ** P < 0.01). All plants except the 3 DAG sample (C–long days) were grown in SD conditions.

