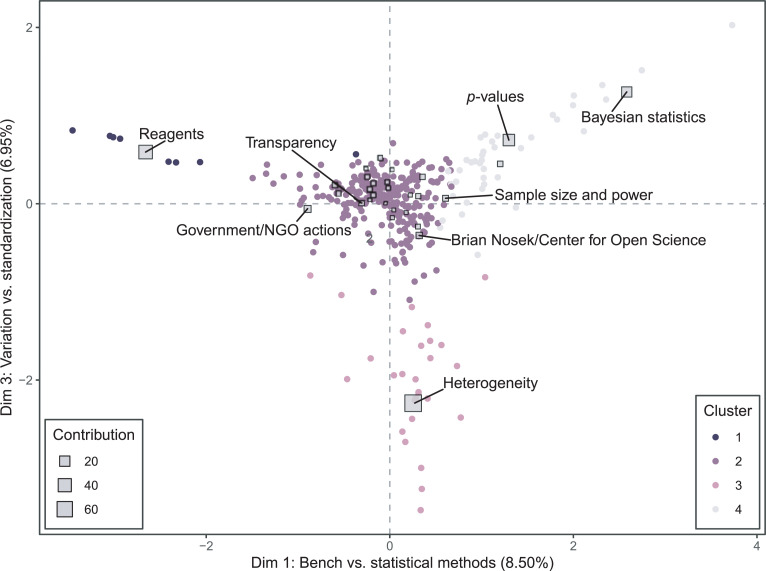
Fig 4. Correspondence analysis biplot depicting dimensions 1 and 3 of the analysis.
Articles that are close together have similar narrative profiles. The closer an article appears to the center of the plot, the more closely it resembles the mean profile for all articles. The further away a theme is from the origin, the more variation there is in how authors discuss that theme. The color of an article’s plotted point (a circle) indicates their label in a hierarchical clustering, based on Euclidean distance in the latent dimensions. The size of a theme’s plotted point (a square) represents the contribution of that theme to constructing the dimensions. The eight most contributing themes are labeled.

