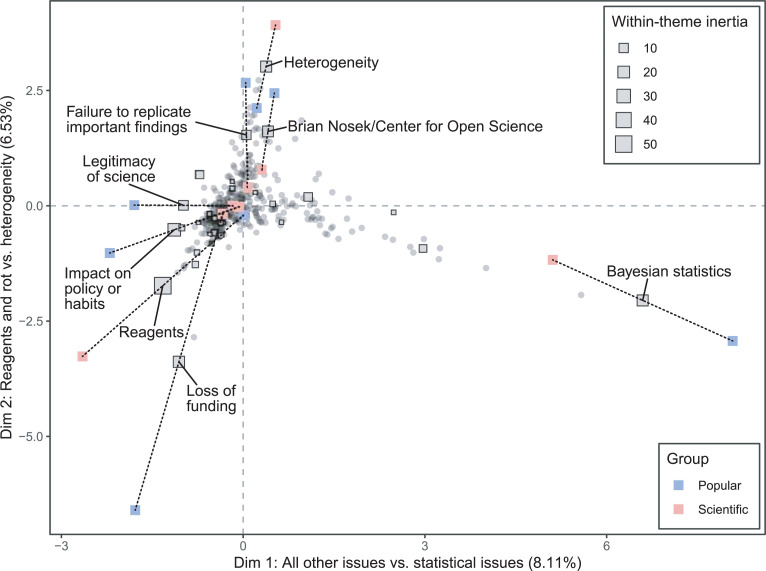
Fig 7. Multiple factor analysis of 353 articles discussing reproducibility, analyzed for 29 themes, with articles grouped by intended audience.
The size of the square indicates the degree of within-theme inertia. The eight themes with the greatest within-theme inertia are labeled, and partial points for those themes are displayed. Red points indicate the location of those themes in the group of articles aimed at a scientific audience, and blue points indicate the theme location for the popular audience group. Grey points indicate the location of the articles on the first factor plane.

