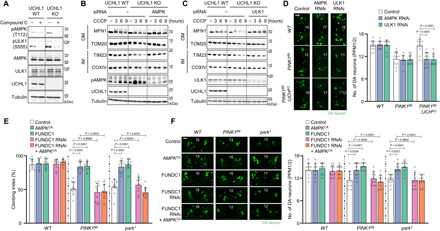
Fig. 4. FUNDC1-mediated mitophagy in UCHL1 KO cells and flies is induced by AMPK and ULK1.

(A) Immunoblot analysis of AMPK and ULK1 phosphorylation in HEK293 UCHL1 WT and KO cells without (−) or with (+) 10 μM compound C treatment. The band intensity of AMPK and ULK1 phosphorylation was quantified in fig. S9A. (B) Immunoblot analysis of mitochondrial outer (MFN1 and TOM20) and inner (TIM23 and COXIV) membrane proteins upon 20 μM CCCP and AMPKα siRNA treatment. The band intensity of the four mitochondrial proteins (MFN1, TOM20, TIM23, and COXIV) was quantified in fig. S9B. (C) Immunoblot analysis of mitochondrial outer (MFN1 and TOM20) and inner (TIM23 and COXIV) membrane proteins upon 20 μM CCCP and ULK1 siRNA treatment. The band intensity of the four mitochondrial proteins (MFN1, TOM20, TIM23, and COXIV) was quantified in fig. S9C. (D) Confocal immunofluorescence images (left) and numbers (right) of DA neurons in the PPM1/2 regions of adult fly brains. n = 10. Green indicates DA neuron. Scale bar, 20 μm. The number in panels indicates the number of DA neurons in each image. (E) Measurement of the climbing ability in the adult flies. n = 10. (F) Confocal immunofluorescence images (left) and numbers (right) of DA neurons in the PPM1/2 regions of adult fly brains. n = 10. Green indicates DA neuron. Scale bar, 20 μm. The number in panels indicates the number of DA neurons in each image. Two-way ANOVA with Sidak’s multiple comparison test was used (D to F). All data were presented as means + SD.
