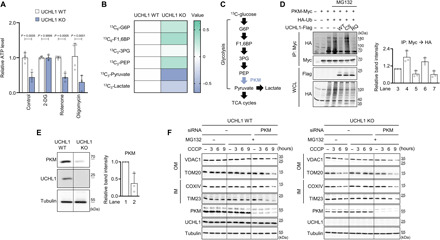
Fig. 5. PKM is a direct target of UCHL1 to control mitophagy.

(A) Measurement of ATP levels in HEK293 UCHL1 WT or KO cells treated with 25 mM 2-DG, 1 μM rotenone, or 10 μM oligomycin. n = 4. (B) Measurement of glycolytic metabolites in HEK293 UCHL1 WT and KO cells after feeding 13C-glucose. The data were shown as a heatmap based on liquid chromatography–mass spectrometry metabolomics results. The row displays metabolites, and the column represents samples. Metabolites decreased are displayed in blue, while metabolites increased are displayed in green. The brightness of each color corresponds to the magnitude of the difference when compared with average value. n = 3. (C) Scheme of the glycolysis pathway. PKM converts phosphoenolpyruvate (PEP) to pyruvate. (D) Left: Immunoblot analysis of PKM ubiquitination in HEK293 cells coexpressing UCHL1 WT, C90S (CS), or R178Q (RQ). The cells were cotransfected with the plasmids carrying Myc-tagged PKM, hemagglutinin (HA)–tagged ubiquitin (Ub), and Flag-tagged UCHL1 WT, C90S, or R178Q and then treated with 20 μM MG132 for 4 hours before cell lysis. IP, immunoprecipitation; WCL, whole-cell lysate. Right: Relative quantification of the anti-HA immunoblot band intensity of the immunoprecipitated proteins by Myc antibody. n = 3. (E) Left: Immunoblot analysis of endogenous PKM in UCHL1 WT and KO HEK293 cells. Right: Relative quantification of the immunoblot band intensity of PKM. n = 3. (F) Immunoblot analysis of mitochondrial outer (VDAC1 and TOM20) and inner (COXIV, and TIM23) membrane proteins upon 20 μM CCCP, 20 μM MG132, and PKM siRNA treatment in UCHL1 WT or KO HEK293 cells. The band intensity of the four mitochondrial proteins (VDAC1, TOM20, TIM23, and COXIV) was quantified in fig. S11C. Two-way ANOVA with Sidak’s multiple comparison test was used (A). All data were presented as means + SD.
