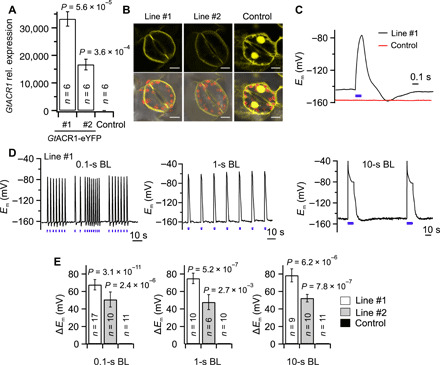
Fig. 1. GtACR1 depolarizes the plasma membrane of tobacco guard cells in response to BL pulses.

(A) Transcript levels of GtACR1-eYFP in guard cells, of two tobacco GtACR1-transformed lines (#1 and #2) and a control line. The transcript numbers of GtACR1 were normalized to 10,000 molecules of actin. (B) Fluorescence signals of eYFP linked to GtACR1 in line #1 (left upper panel) and #2 (middle upper panel) or free eYFP (right upper panel) in control tobacco guard cells and the overlay with the chlorophyll fluorescence signal in the corresponding lower panels. Scale bars, 10 μm. (C) Membrane potential recordings of tobacco guard cells of line #1 (black curve) and control (red curve) stimulated with a single blue light (BL) pulse of 0.1 s (as shown by the blue bar, λ = 470 nm, 17 mW/mm2). (D) Membrane potential measurements of tobacco guard cells (line #1) stimulated with BL pulses of 0.1, 1, and 10 s (λ = 470 nm, 17 mW/mm2), as indicated by the blue bars below the traces. (E) Average depolarization of guard cells in line #1, line #2, and control provoked by BL pulses of 0.1, 1, and 10 s. In (A) and (E), the P values were determined with a Student’s t test using values of GtACR1 line #1 or #2 and control plants; the number of experiments is given in the respective bars, and error bars represent SE.
