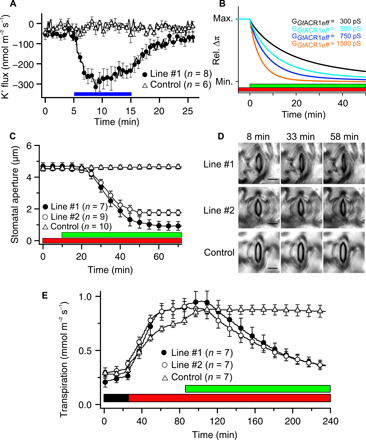
Fig. 7. GtACR1 enables light-controlled stomatal closure.

(A) Average values of K+ flux of tobacco guard cells in epidermal peels, which were stimulated with a 10-min BL pulse (0.15 mW/mm2). The SISE technique was used to determine K+ efflux from guard cells of line #1 (solid circle) and control plants (open triangle). Error bars represent SE. (B) Osmotic pressure difference across the plasma membrane predicted by the GuardIon model. (C and D) Light-controlled stomatal closure in GtACR1-expressing lines (#1 and #2) and control plants. (C) The aperture of stomata in intact plants was first monitored in red light only (λ = 630 nm, 0.018 mW/mm2), and thereafter, additional green light was provided (λ = 525 nm, 0.57 mW/mm2), as indicated by the bars below the graph. (D) Representative images of stomata before stimulation with green light (8 min) and during green light stimulation (33 and 58 min) are shown of lines #1, #2, and control plants. Scale bars, 15 μm. See also movie S1. (E) Transpiration of tobacco leaves, as measured in gas exchange setup, in darkness, during illumination with red light only (λ = 650 nm, 0.067 mW/mm2), and after addition of green light (λ = 520 nm, 0.017 mW/mm2), as indicated by the bars below the traces. Error bars represent SE (n = 7).
