
Fig. 2. Thermomechanics of dry transfer printing.
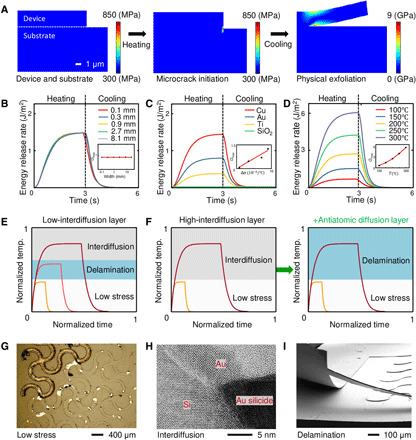
(A) Consecutive schematic diagram of the stress distribution during the crack initiation and physical exfoliation steps. (B) Energy release rate for different widths of the device during the thermal cycle. (C) Energy release rate for different materials of the device layer during the thermal cycle. (D) Energy release rate for different heating temperatures during the thermal cycle. Schematic diagrams of thermal delamination approaches using (E) a low-interdiffusion layer and (F) a high-interdiffusion layer. (G) Delamination failure due to low stress and the corresponding optical image. Photo credit: Seungkyoung Heo, Daegu Gyeongbuk Institute of Science and Technology. (H) Delamination failure due to Au silicide formation and the corresponding transmission electron microscopy image. Photo credit: Seungkyoung Heo, Daegu Gyeongbuk Institute of Science and Technology. (I) Successful delamination with atomic diffusion control and the corresponding SEM image. Photo credit: Seungkyoung Heo, Daegu Gyeongbuk Institute of Science and Technology.