
Fig. 3. The comparison of periodicity for x-ray and magnetic field for 2.6 Jupiter rotations.
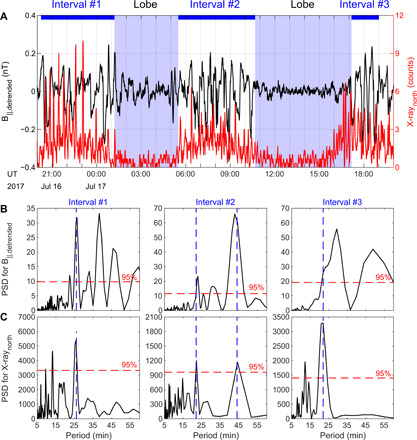
(A) Detrended field-aligned magnetic field component (black) and northern x-ray emission (red). Lomb-Scargle periodograms of the detrended field-aligned magnetic field B∥ (B) and northern x-ray emission (C) for three intervals marked by the blue bars on the top. The red dashed lines indicate the confidence level of 95% for each analysis. The blue dashed vertical lines show shared x-ray and magnetic field power spectral density (PSD) periodogram peaks.