
Fig. 2. An isoflavone diet decreases cellular infiltration of CD4+ T cells into the CNS after EAE.
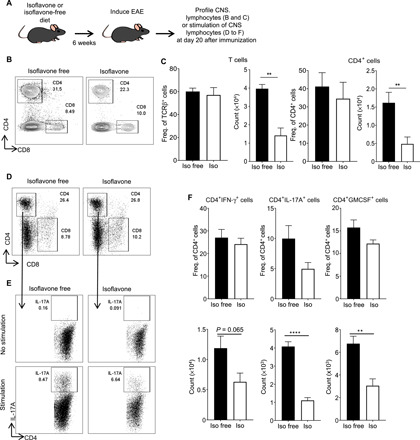
(A) Schematic of experimental design. Four- to six-week-old female mice were placed on the indicated diet for 6 weeks before immunization with MOG35-55/CFA to induce EAE. Mice were euthanized 20 days after immunization, and CNS was harvested for flow cytometric analysis of CNS leukocyte infiltration. (B) Representative flow cytometric plots of CD4+ and CD8+ T cells (gated on CD45+CD19−TCRβ+ cells) in the CNS of mice fed an isoflavone-free or isoflavone diet following the induction of EAE. Numbers represent the frequency of cells in the indicated gate. (C) The frequency and absolute number of total T cells and CD4+ T cells in the CNS following induction of EAE, as in (B). Data are representative of three independent experiments with five mice per group. (D) Representative flow cytometric analysis of CD4+ and CD8+ T cells (gated on CD45+CD19−TCRβ+ cells) in the CNS of mice fed an isoflavone or isoflavone-free diet, following the induction of EAE, and stimulated with PMA and ionomycin in the presence of brefeldin A (BFA). (E) Representative flow cytometric analysis of the IL-17A+CD4+ T cells isolated from mice, as in (D), following stimulation with PMA and ionomycin in the presence of (BFA). Numbers represent the frequency of cells in the indicated gate. Plots are gated on live CD45+TCRβ+CD4+ T cells from (D). (F) Frequency and absolute number of CD4+IFN-γ+ T cells, CD4+IL-17A+ T cells, and CD4+GMCSF+ T cells isolated from the CNS of mice in (D), following stimulation with BFA (no stimulation), or BFA and PMA/ionomycin (stimulation). Data are representative of two independent experiments with five mice per group. P value was determined by Student’s t test. **P < 0.001; ****P < 0.0001.