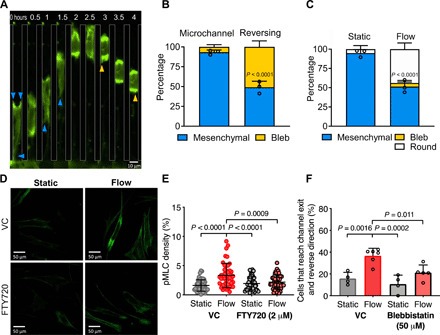
Fig. 3. Fluid shear activates myosin-II contractility, which is required for reversal of fibroblast migration direction.

(A) Representative images of a migrating fibroblast expressing Lifeact-GFP imaged by epifluorescence at ×20 magnification. Shear flow is present perpendicular to the microchannel exits. Blue arrowheads mark cell protrusions. Yellow arrowheads mark cell blebs. (B) Migration phenotype of Lifeact-GFP–expressing fibroblasts in microchannels with flow present at the exits. Left bar, phenotype analysis of all cells migrating in the microchannel before reaching the end. Right bar, phenotype analysis of cells that have reached the end of the microchannel and reversed their migration direction. (C) Percentage of Lifeact-GFP–expressing fibroblasts exhibiting a protrusive, blebbing, or round morphology after exiting the microchannel into a 2D-like area under static (left) or flow (right) conditions. P value was calculated by two-way ANOVA followed by Sidak’s multiple comparisons test. Data represent means ± SD from three independent experiments. Data points represent percentage values of protrusive cells from individual experiments. (D) Representative confocal images of cells in 2D under static conditions or exposed to shear flow for 5 min and then fixed and immunostained for pMLC. (E) Quantification of pMLC fluorescence density. Data points represent values for individual cells pooled from three independent experiments. (F) Percentage of cells that reverse migration direction when treated with blebbistatin (50 μM) or a vehicle control. Data represent means ± SD from ≥3 independent experiments. Data points represent the percentage value from individual experiments. P values in (E) and (F) were calculated by one-way ANOVA followed by Tukey’s multiple comparisons test.
