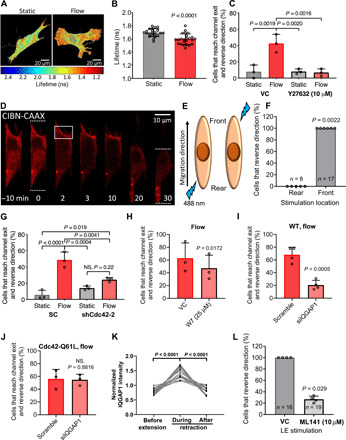
Fig. 4. RhoA and Cdc42 act in concert to mediate the reversal of migration direction.

(A) Representative pixelwise heatmaps of RhoA FRET fluorescence lifetimes (ns) in fibroblasts under static or flow conditions. (B) Quantification of FLIM-FRET lifetimes. Data points represent the average fluorescent lifetime over a whole cell, pooled from three independent experiments. (C) Percentage of cells that reverse migration direction following treatment with Y27632 (10 μM) or vehicle control. (D) Fibroblasts expressing OptoGEF-RhoA and CAAX-CIBN-GFP. Dotted lines indicate the cell’s leading and trailing edges during confined migration at t = 0 and 30 min. For 2 min, the cell moves upward and is then stimulated with blue light in the region enclosed by the box. OptoGEF-RhoA enrichment is observed at the plasma membrane in this region, and the cell reverses its migration direction. (E) OptoGEF-RhoA–expressing fibroblasts migrating in microchannels were stimulated with blue light at the front or rear. (F) Percentage of cells that reversed their migration direction after optogenetic stimulation at the front or rear. Data points represent percentage of cells from an individual experiment. n = number of cells assayed. Percentage of (G) scramble control or Cdc42-KD cells, (H) vehicle control or W7-treated cells, (I) scramble control or siIQGAP1 cells, and (J) and scramble control or siIQGAP1 cells transduced with the constitutively active Cdc42-Q61L that reverse migration direction. NS, not significant; WT, wild type. (K) GFP-IQGAP1 intensity at cell edge during extension-retraction events (n = 18 cells from five independent experiments). (L) Percentage of OptoGEF-RhoA–expressing fibroblasts treated with ML141 (10 μM) or vehicle control that reverse their migration direction after stimulation with blue light at the leading edge (LE). Data represent means ± SD from three independent experiments (C and G to J). Statistical comparisons were made using Student’s t test (B and H to J) or one-way (C and G) or two-way ANOVA (K) followed by Tukey’s post hoc test and the Mann-Whitney U test (L and F). See also figs. S4 and S5.
