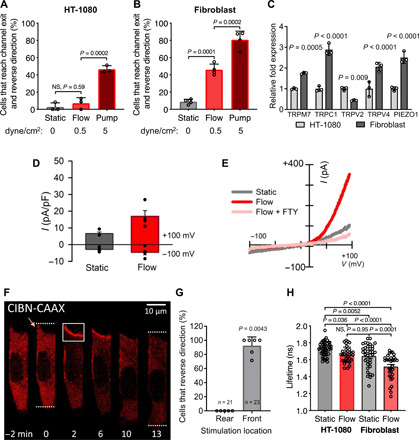
Fig. 5. HT-1080 fibrosarcoma cells display reduced TRPM7 activity, fluid shear sensitivity, and RhoA activity.

(A) Percentage of HT-1080 fibrosarcoma or (B) primary dermal fibroblasts that reverse migration direction at the end of the microchannels under static or prescribed shear flow conditions. (C) Relative mRNA expression of HT-1080 and fibroblast cells assessed by qPCR. Data represent means ± SD from ≥3 independent experiments (A to C). (D) Current-voltage relationships of whole-cell cationic currents recorded from HT-1080 fibrosarcoma cells under static and flow conditions. (E) Mean current densities measured under static, flow, and flow + FTY conditions in human wild-type primary fibroblasts (n = 4). P = 0.03 paired t test static versus flow. (F) HT-1080 cells expressing OptoGEF-RhoA and CAAX-CIBN-GFP. Dotted lines indicate the cell’s leading and trailing edges during confined migration at t = 0 or 13 min. Yellow arrow indicates a leading edge protrusion at t = 0. For 2 min, the cell moves upward and is then stimulated with blue light in the region indicated by the white box. OptoGEF-RhoA enrichment is observed at the plasma membrane in this region, and the cell reverses its migration direction. (G) Percentage of HT-1080 cells that reversed their migration direction after optogenetic stimulation at the front or rear. Data points represent percentage of cells from an individual experiment. n = number of cells assayed. (H) Comparison of RhoA FLIM for HT-1080 and fibroblasts in 2D under static or flow conditions. HT-1080 cells have reduced RhoA activity under static conditions compared with fibroblasts. Flow increases HT-1080 RhoA activity to similar levels to fibroblasts under static conditions but not to the level of fibroblasts in flow. Statistical comparisons were made using one-way ANOVA followed by Tukey’s post hoc test (A to C and H) or the Mann-Whitney U test (G).
