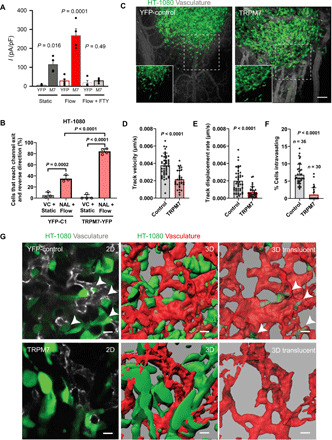
Fig. 6. HT-1080 fibrosarcoma cells gain acute shear sensitivity upon overexpressing TRPM7 and display reduced invasion out of the primary tumor and intravasation.

(A) Mean current densities measured under static and flow conditions in the presence or absence of FTY in HT-1080 cells transfected with YFP or mouse TRPM7-YFP. (B) Percentage of HT-1080 cells transfected with either TRPM7-YFP or YFP-C1 that reverse migration direction under static or shear flow conditions. Cells experiencing shear flow were treated with 50 μM naltriben (NAL) while those under static conditions with vehicle control. Data represent means ± SD from ≥3 independent experiments with >40 total cells analyzed per condition. Statistical comparison was performed using one-way ANOVA followed by Tukey’s post hoc test. (C) Representative images showing primary tumors formed by control (YFP-C1) or TRPM7-overexpressing (TRPM7-YFP) HT-1080 cells. Images are maximum intensity projections of 3D reconstructions. Insets show YFP signal alone from the areas marked by dashed squares. Quantification of average cancer cell (D) track velocity and (E) displacement rate at the invasive fronts of tumors formed by control or TRPM7-overexpressing HT-1080 cells. (F) Quantification of cancer cell intravasation rate for tumors formed by control or TRPM7-overexpressing HT-1080 cells. (G) Representative images from the primary tumors formed by control or TRPM7-overexpressing HT-1080 cells showing single optical sections (left), 3D reconstructions (middle), and 3D translucent rendering of vasculature with intravasated cancer cells inside the vascular lumen (right). White arrowheads point to intravasating HT-1080 cells at vascular wall breaches. In (D) to (F), data are means + SD with statistical comparison made using unpaired t test (D and E) or Mann-Whitney test (F). Scale bars, 100 μm (C) or 20 μm (G). See also fig. S6.
