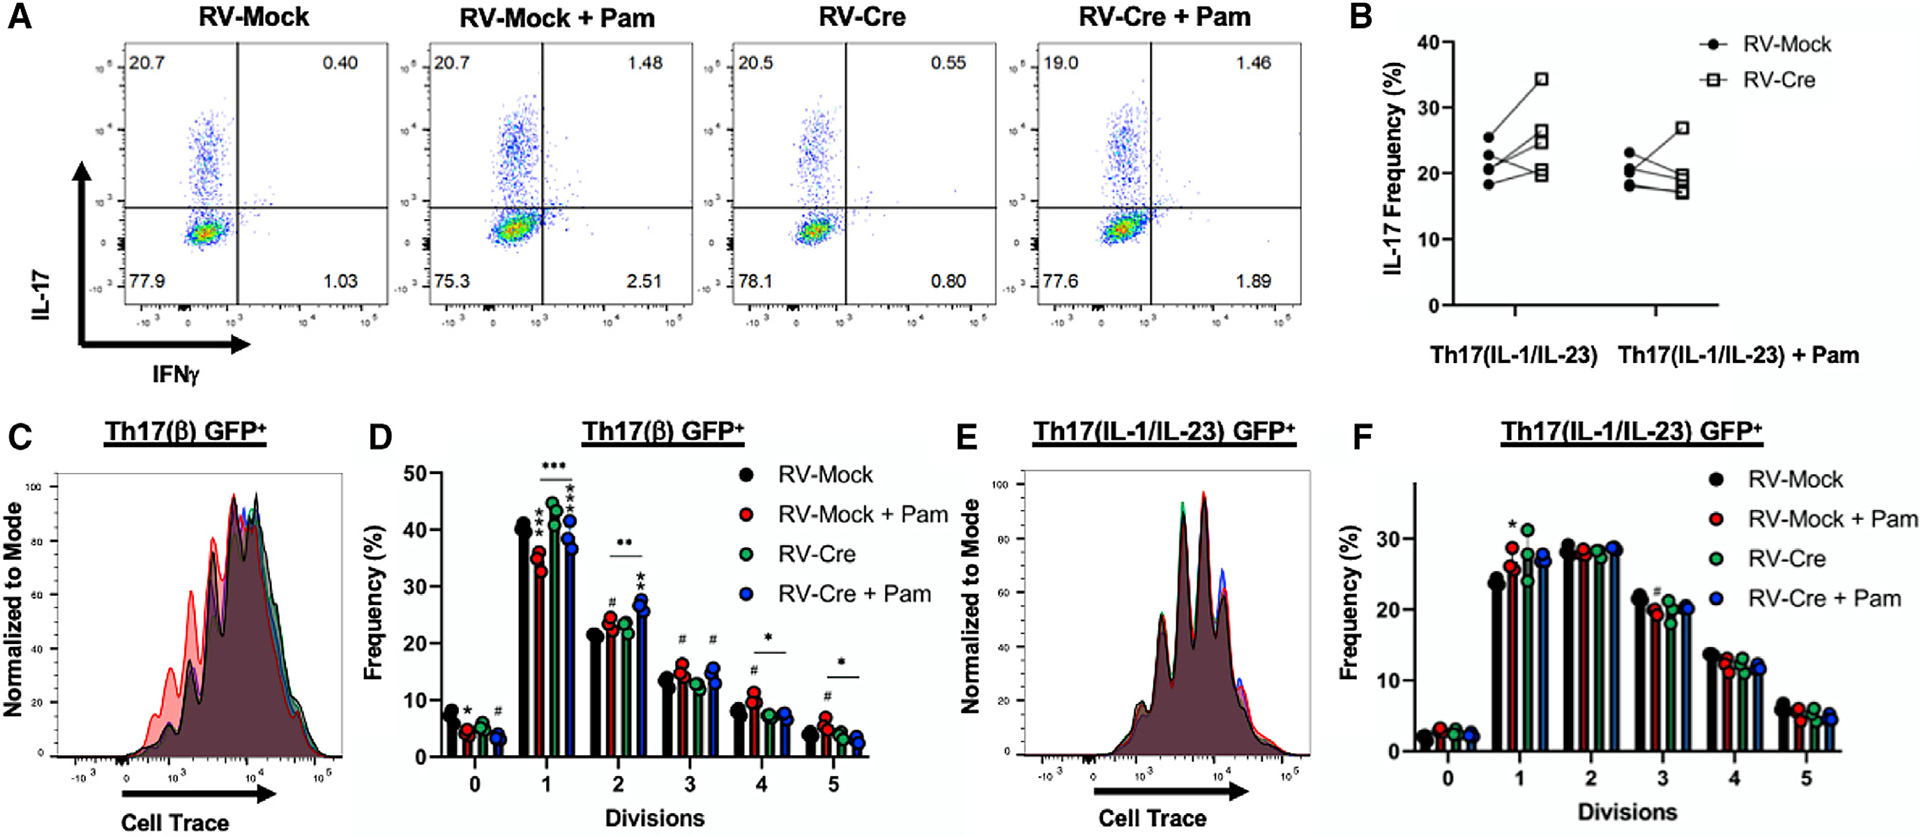
Figure 1. TLR2 signaling increases the proliferation of Th17(β) cells but does not synergize with IL-1β and IL-23.

(A) Representative flow cytometry analysis (IL-17 and IFN-γ) of TLR2f/f Th17(IL-1/IL-23) cells following 4-day differentiation and transduction of control vector (RV-Mock) or Cre (RV-Cre).
(B) Compilation of data from 2 representative experiments.
(C–F) Representative proliferation histograms and pooled analysis of TLR2f/f Th17(β) (C and D) or Th17(IL-1/IL-23) (E and F) cells following 4-day differentiation. n =3 technical replicates per group. Cells were transduced with RV-Mock or RV-Cre 1 day following initial TCR activation and gated on retrovirus (GFP+) for analysis. Data are representative of 3 individual experiments and are presented as means ± SDs. Comparisons between untreated and PAM3CSK4-stimulated cells are shown directly above the bars, while comparisons between RV-Mock and RV-Cre are shown by symbols above the lines. #p < 0.05, *p < 0.01, **p < 0.001, ***p <0.0001 by 2-way ANOVA.
