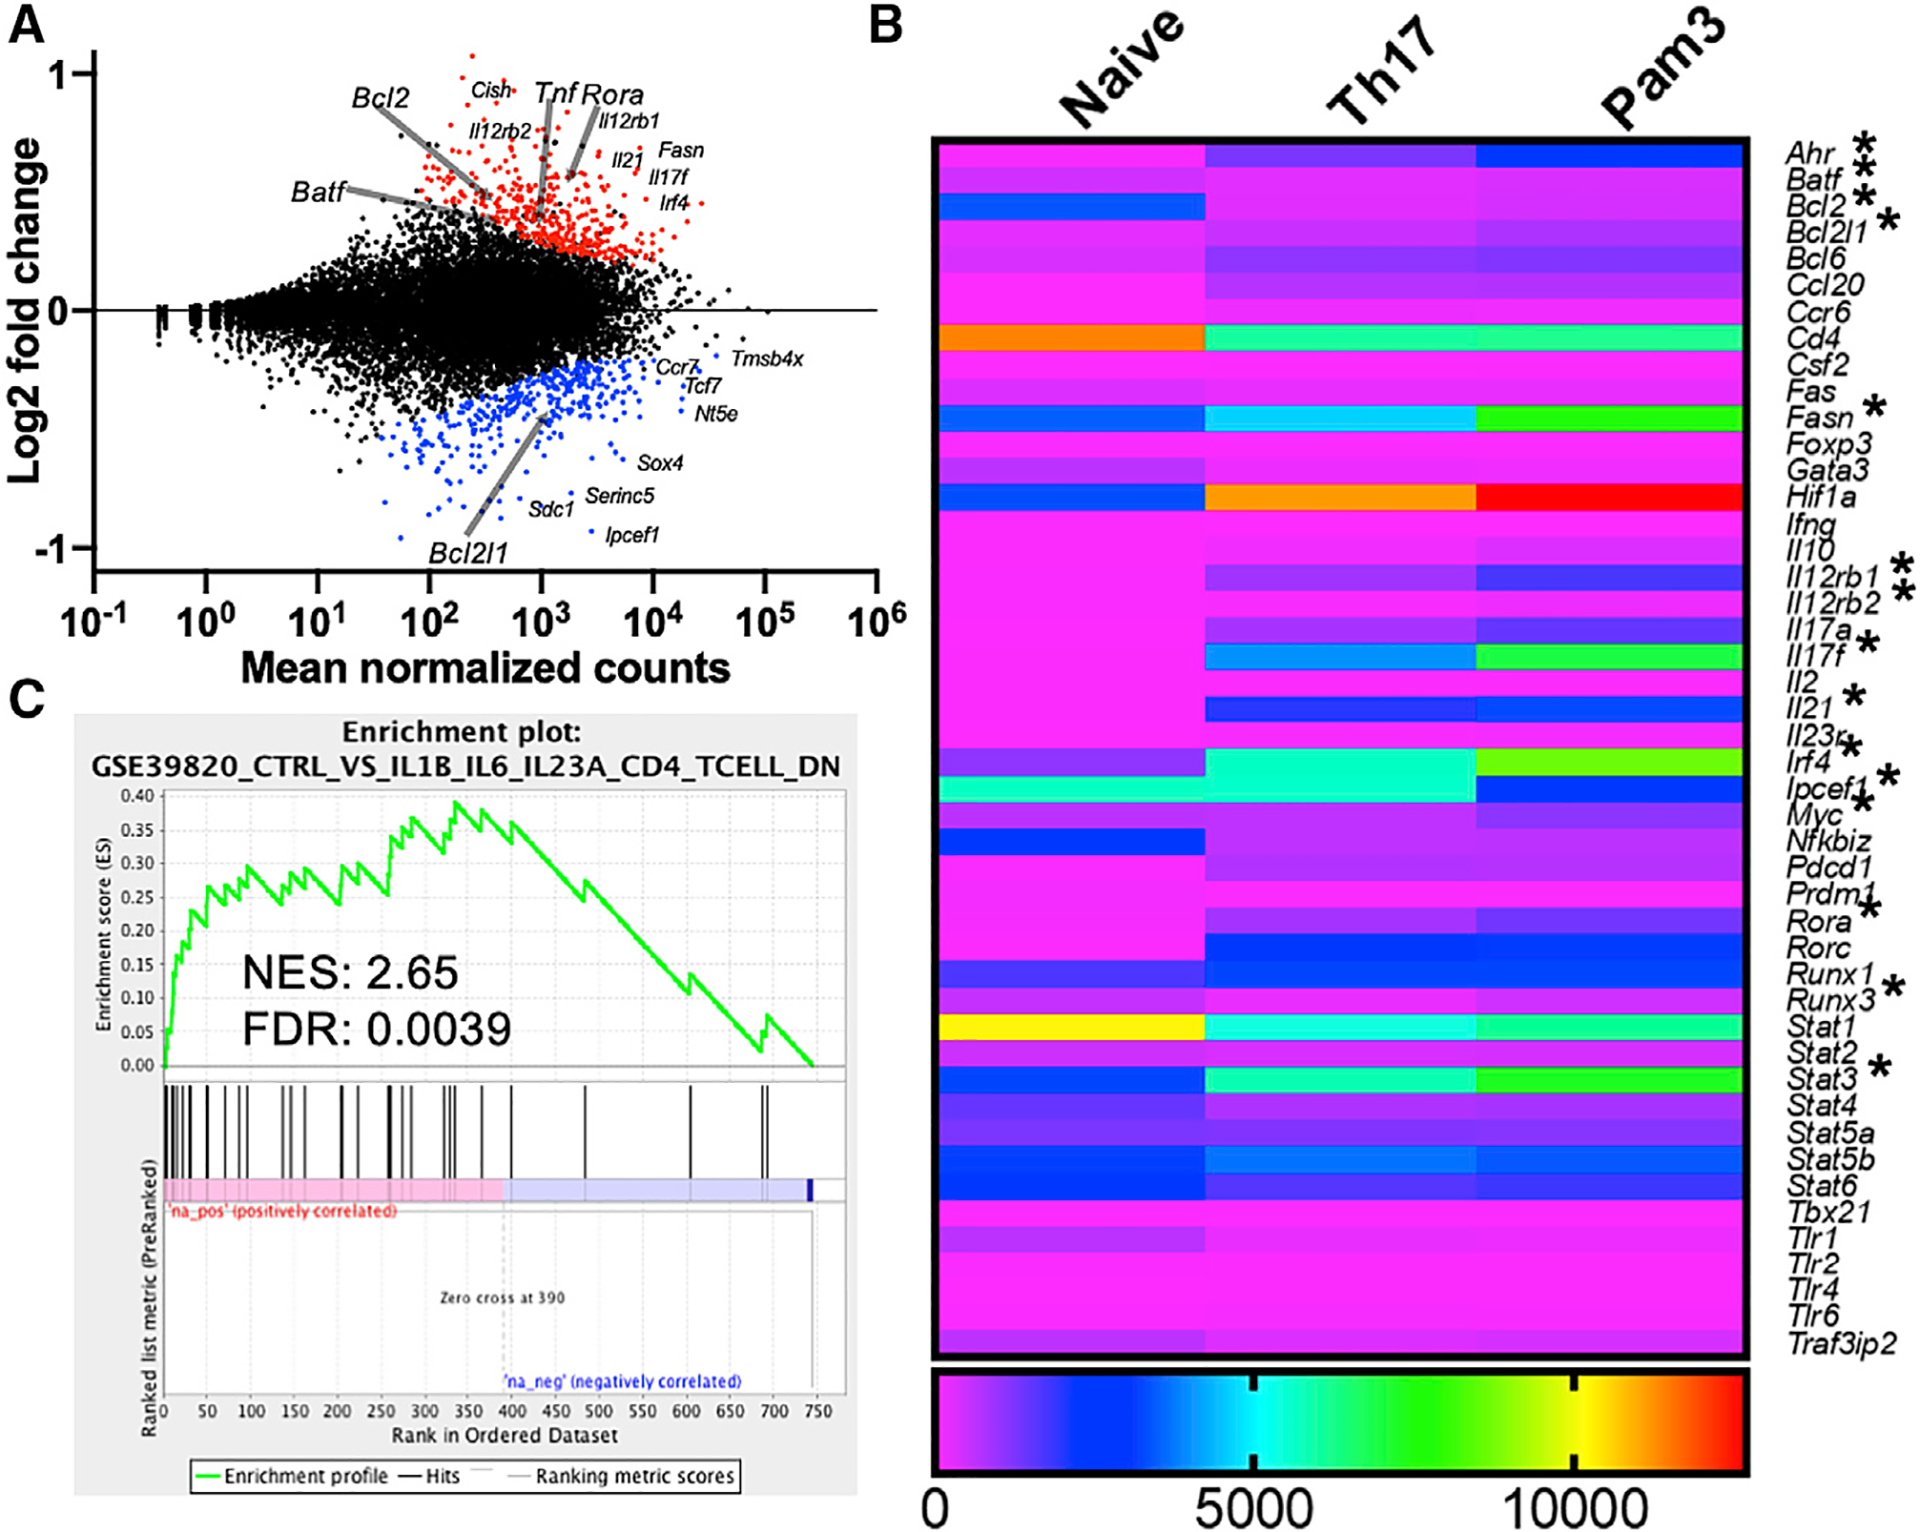
Figure 3. TLR2 activation alters the transcriptional program of differentiating Th17 cells.

(A) Graphical representation of genes upregulated (red) or downregulated (blue) in PAM3CSK4-activated Th17(β) cells compared to non-PAM-treated Th17 cells by RNA sequencing. n = 2 biological replicates per group.
(B) Heatmap comparing expression levels of selected genes from naive CD4+, Th17(β) cells, and Th17(β) cells stimulated with PAM3CSK4. *p < 0.01 (FDR).
(C) Gene set enrichment analysis of TLR2-stimulated Th17 cells compared to Th17 cells generated with IL-1, IL-6, and IL-23. Normalized enrichment score (NES) and statistical significance (FDR) are listed.
