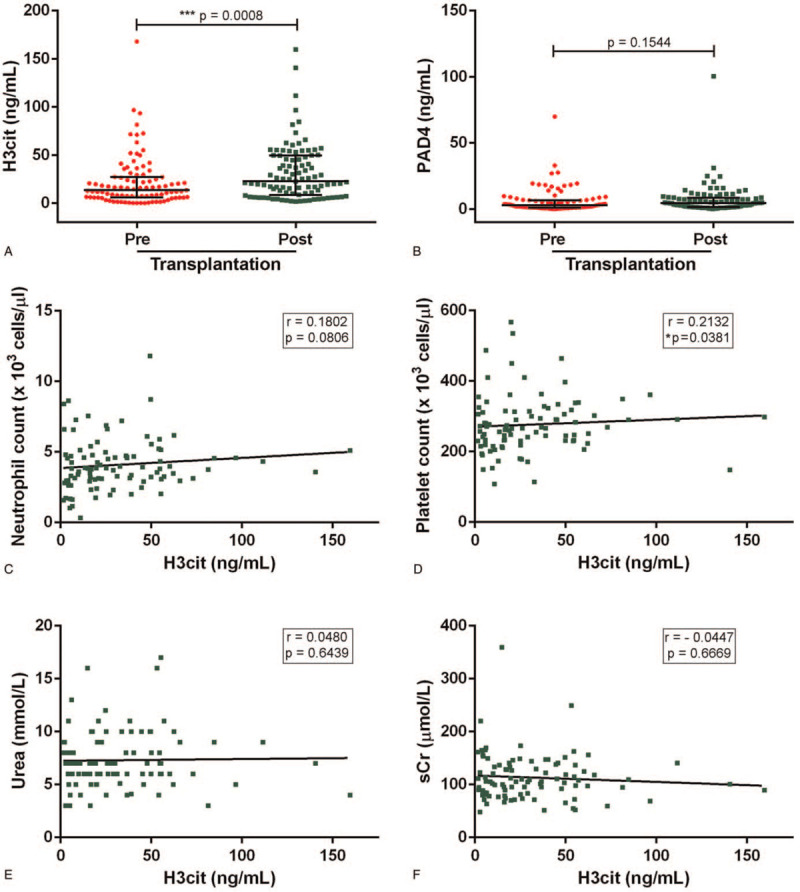
Figure 2.

Changes in NETosis markers after renal transplantation. (A) H3cit and (B) PAD4 were quantified in serum from ESRD patients pre- and post-transplantation (n = 95) by ELISA. Results are shown as median and IQR, each data point represents a unique patient/healthy donor; ∗∗∗P < .001 by Wilcoxon rank test. For post-transplant samples, correlation of H3cit with (C) neutrophil count, (D) platelet count, (E) urea, and (F) sCr was assessed. Spearman's correlation coefficients were calculated and are shown in each panel. ELISA = enzyme-linked immunosorbent assay, ESRD = end-stage renal disease, IQR = interquartile range.
