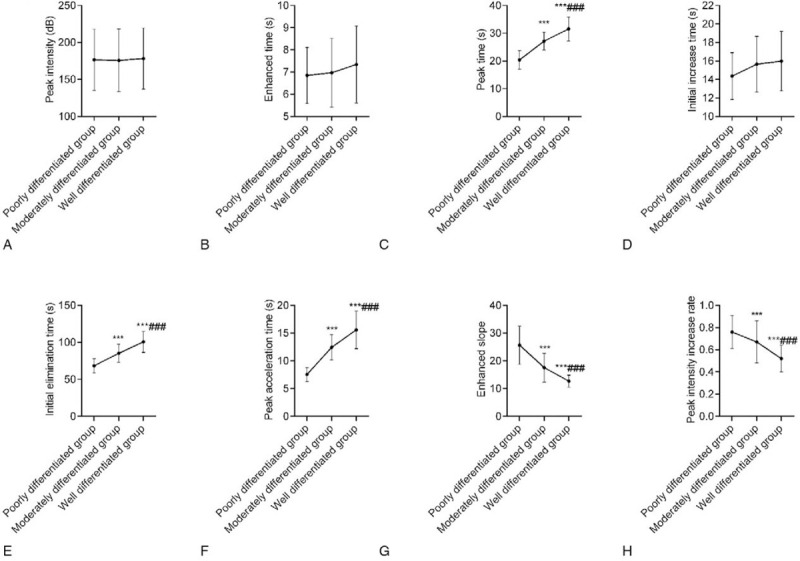
Figure 2.

Comparison of quantitative CEUS parameters among the 3 groups. A: There were no significant differences in the peak intensity among the 3 groups. B: There were no significant differences in the enhancement time among the 3 groups. C: The TTP was highest in the highly differentiated group and was higher in the moderately differentiated group than in the poorly differentiated group; D: There were no significant differences in the wash-in time among the 3 groups; E: The wash-out time was highest in the highly differentiated group and was higher in the moderately differentiated group than in the poorly differentiated group; F: The PAT was highest in the highly differentiated group and was higher in the moderately differentiated group than in the poorly differentiated group; G: The ESR was lowest in the highly differentiated group and was lower in the moderately differentiated group than in the poorly differentiated group; H: The PIIR was lowest in the highly differentiated group and was lower in the moderately differentiated group than in the poorly differentiated group. Compared with the poorly differentiated group, ∗∗∗P < .001; compared with the moderately differentiated group, ∗∗∗P < .001. CEUS = contrast-enhanced ultrasonography, ESR = enhancing slope rate, PAT = peak accelerating time, PDGF = platelet-derived growth factor, PIIR = peak intensity increasing rate, TTP = the time to peak.
