Abstract
Background:
Esophageal squamous cell carcinoma (ESCC) is a common human malignancy worldwide. The tumorigenesis mechanism in ESCC is unclear.
Materials and methods:
To explore potential therapeutic targets for ESCC, we analyzed 3 microarray datasets (GSE20347, GSE38129, and GSE67269) derived from the gene expression omnibus (GEO) database. Then, the GEO2R tool was used to screen out differently expressed genes (DEGs) between ESCC and normal tissue. Gene ontology function and kyoto encyclopedia of genes and genomes pathway enrichment analysis were performed using the database for annotation, visualization and integrated discovery to identify the pathways and functional annotation of DEGs. Protein–protein interaction of these DEGs was analyzed based on the search tool for the retrieval of interacting genes database and visualized by Cytoscape software. In addition, we used encyclopedia of RNA interactomes (ENCORI), gene expression profiling interactive analysis (GEPIA), and the human protein atlas to confirm the expression of hub genes in ESCC. Finally, GEPIA was used to evaluate the prognostic value of hub genes expression in ESCC patients and we estimated the associations between hub genes expression and immune cell populations (B Cell, CD8+ T Cell, CD4+ T Cell, Macrophage, Neutrophil, and Dendritic Cell) in esophageal carcinoma (ESCA) using tumor immune estimation resource (TIMER).
Results:
In this study, 707 DEGs (including 385 upregulated genes and 322 downregulated genes) and 6 hub genes (cyclin B1 [CCNB1], cyclin dependent kinase 1 [CDK1], aurora kinase A [AURKA], ubiquitin conjugating enzyme E2C [UBE2C], cyclin A2 [CCNA2], and cell division cycle 20 [CDC20]) were identified. All of the 6 hub genes were highly expressed in ESCC tissues. Among of them, only CCNB1 and CDC20 were associated with stage of ESCC and all of them were not associated with survival time of patients.
Conclusion:
DEGs and hub genes were confirmed in our study, providing a thorough, scientific and comprehensive research goals for the pathogenesis of ESCC.
Keywords: esophageal carcinoma, hub genes, expression profiling data, bioinformatics analysis, differently expressed genes
1. Introduction
Esophageal carcinoma (ESCA) is one of the most common malignancies worldwide and ranks seventh in terms of incidence and sixth in mortality overall.[1] Esophageal squamous cell carcinoma (ESCC) accounts for about 90% of ESCA.[2] Surgery is the first choice for the treatment of ESCC, but its five-year survival rate is around 15% to 25%.[3] Recurrence and metastasis are the main reasons for poor prognosis in ESCC therapy, which remain challenges in clinical practices.[4] So far, the molecular mechanism of the occurrence and development of ESCC has not been fully clarified. Better understanding of the genetic and molecular disorders of the disease is the key to early diagnosis, appropriate treatment and improved prognosis of patients with ESCC.
Comprehensive analysis of multiple datasets provides the capabilities to properly identify and assess the pathways and genes that mediate the biological processes associated with ESCC. In this study, we tried to detect novel indicators of poor prognosis in ESCC patients and endeavor to provide potential therapeutic targets for this challenging disease. To detect the differentially expressed genes (DEGs) between ESCC and healthy human esophageal tissue, bioinformatics methods were used to analyze the gene expression profiling data downloaded from the gene expression omnibus (GEO) database. Gene ontology (GO) functional annotation analysis and kyoto encyclopedia of genes and genomes (KEGG) pathway enrichment analysis were performed for the screened DEGs. Then, we established a protein–protein interaction (PPI) network to identify hub genes related to ESCC. The survival analysis of these hub genes was performed using the GEPIA database. We believe our data can enhance the level of understanding about the development and progression of ESCC.
2. Materials and methods
2.1. Data source
The gene expression datasets (GSE20347, GSE38129, and GSE67269) analyzed in this study was obtained from the Gene Expression Omnibus (GEO, https://www.ncbi.nlm.nih.gov/geo/) of the National Center for Biotechnology Information (NCBI).[5] These expression microarrays used the platform GPL571: Affymetrix Human Genome U133A 2.0 Array. In total, 126 ESCC and 126 normal specimens were obtained from these data. All of the data were freely available online, and this study did not involve any experiment on humans or animals performed by any of the authors.
2.2. Data processing of differently expressed genes
The GEO2R online analysis tool (https://www.ncbi.nlm.nih.gov/geo/geo2r/) is an online toll that allows users to compare different groups of samples in a GEO series to examine differentially expressed genes.[6] We used it to detect the DEGs between ESCC and normal samples, and the adjusted P value and |logFC| were calculated. Genes that met the cut-off criteria, adjusted P < .05 and |logFC|≥1, were considered as DEGs. Statistical analysis was carried out for each dataset, and the intersecting part was identified using the venn diagram web tool (https://bioinformatics.psb.ugent.be/webtools/Venn/).
2.3. Gene ontology and kyoto encyclopedia of genes and genomes pathway analysis of differently expressed genes
GO analysis is a common useful method for large scale functional enrichment research; gene functions can be classified into biological process, molecular function (MF), and cellular component.[7] KEGG is a widely used database which stores a lot of data about genomes, biological pathways, diseases, chemical substances, and drugs.[8] GO annotation analysis and KEGG pathway enrichment analysis of DEGs in this study was performed using the database for annotation, visualization and integrated discovery tools (https://david.ncifcrf.gov/) which can provide systematic and integrative functional annotation for investigators.[9]P < .01 and gene counts ≥30 were regarded as statistically significant.
2.4. Protein–protein interaction network construction and hub gene identification
Protein protein interaction network (PPI network) is essential for illustrating the molecular mechanisms of key cellular activities in carcinogenesis. The search tool for the retrieval of interacting genes database (http://string-db.org/)[10] was used to analyze the PPI information and evaluate the potential PPI relationship. An interaction score of 0.7 was regarded as the cut-off criterion. Subsequently, the PPI network was visualized by Cytoscape software (version 3.7.2, www.cytoscape.org/). CytoHubba, a plugin in Cytoscape, was used to calculate the top 20 nodes ranked by MCC, MNC, Degree and Stress. Then, a Venn diagram was used to identify the hub genes.
2.5. Checking of hub gene
Expression level of these 6 identified hub genes in ESCC was analyzed at ENCORI, GEPIA, and the human protein atlas. ENCORI (http://starbase.sysu.edu.cn/) is an online public accessed platform for studying RNA interactions that contained data of 32 cancer types obtained from 10,885 RNA-seq and 10,546 miRNA-seq data.[11] Gene expression profiling interactive analysis (GEPIA, http://gepia.cancer-pku.cn/detail.php) dataset provides customizable functions such as tumor/normal differential expression analysis, profiling according to cancer types or pathological stages, patient survival analysis, similar gene detection, correlation analysis and dimensionality reduction analysis.[12] The human protein atlas (http://v13.proteinatlas.org/) was launched in 2003 with the aim of creating a map of protein expression patterns in normal cells, tissues and cancer. At present, 11 200 unique proteins corresponding to over 50% of all human protein encoding genes have been analyzed. This database also provides an important source of information for numerous biomedical research projects, including biomarker discovery efforts.[13]
2.6. Association of the hub genes with tumor stage, survival time of patients, and tumor-infiltrating immune cells
GEPIA was used to analyze the expression of the hub genes with tumor stage for ESCA. Meanwhile, GEPIA and ENCORI were used to analyze the correlation between the mRNA levels of the hub genes and the survival time of patients with ESCA in 162 patients of ESCA. Tumor immune estimation resource (TIMER) (https://cistrome.shinyapps.io/timer/) is a comprehensive resource for systematic analysis of tumor-infiltrating immune cells across 32 different cancers from TCGA database.[14] In this experiment, we estimated the associations between hub genes expression and immune cell populations (B Cell, CD8+ T Cell, CD4+ T Cell, Macrophage, Neutrophil, and Dendritic Cell) in ESCA using TIMER.
3. Results
3.1. Identification of differently expressed genes
In this study, 3 gene expression profiles (GSE20347, GSE38129, and GSE67269) were selected from GEO. As demonstrating in Table 1, there are 17 ESCC samples and 17 normal samples in GSE20347, 30 ESCC samples and 30 normal samples in GSE38129 and 79 ESCC samples and 79 normal samples in GSE67269. Comparing ESCC samples with normal esophageal samples based on the criteria of adjusted P < .05 and |logFC|≥1, we found there are 1323 DEGs that were identified from GSE20347, including 607 upregulated genes and 716 downregulated genes. In GSE38129, 923 DEGs were identified; 500 genes were upregulated, and 423 genes were downregulated. And from GSE672269, 960 DEGs including 495 upregulated genes and 465 downregulated genes were identified (Table 2). Then, the intersection of the DEG profiles was get using venn analysis. Finally, there are 707 DEGs regarded as significantly differentially expressed among all 3 groups, including 385 were significantly upregulated genes (Fig. 1A) and 322 were downregulated (Fig. 1B).
Table 1.
Statistics of tissues of 3 microarray database.
Table 2.
Statistics of DEGs of 3 microarray database.
| Dataset ID | Upregulated genes | downregulated genes | DEGs |
| GSE20347 | 607 | 716 | 1323 |
| GSE38129 | 500 | 423 | 923 |
| GSE67269 | 495 | 465 | 960 |
DEGs = differentially expressed genes.
Figure 1.
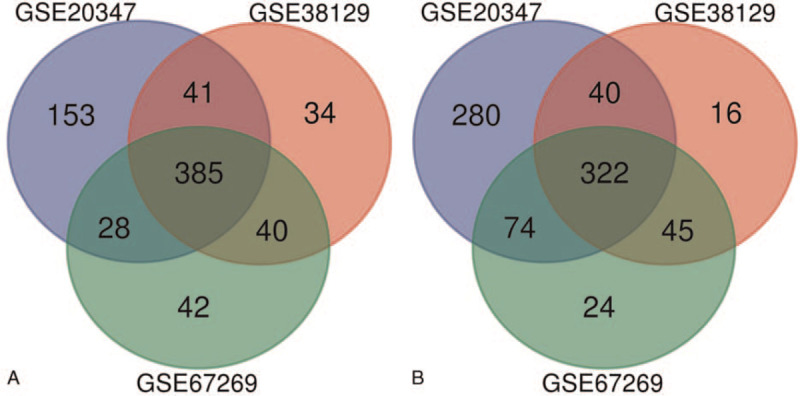
Venn diagram of DEGs common to all 3 GEO datasets. (A) Upregulated genes. (B) Downregulated genes.
3.2. Gene ontology and pathway functional enrichment analysis
GO function and KEGG pathway enrichment analysis for DEGs were performed using the online tool database for annotation (Table 3). The enriched GO terms were divided into CC, biological process, and MF ontologies. Biological process enrichment analysis indicated that DEGs were correlated with extracellular matrix organization, cell division, mitotic nuclear division, response to drug, cell adhesion, cell proliferation, positive regulation of cell proliferation and oxidation-reduction process. For cell component, DEGs were enriched mainly in extracellular exosome, extracellular space, extracellular matrix, proteinaceous extracellular matrix, extracellular region, cytoplasm, nucleoplasm, membrane, cytosol, endoplasmic reticulum, cell surface, perinuclear region of cytoplasm. And MF analysis showed that the DEGs were significantly enriched in protein binding and calcium ion binding. In addition, the results of KEGG pathway analysis showed that DEGs were mainly enriched in Cell cycle, ECM-receptor interaction and Focal adhesion.
Table 3.
Significantly enriched GO terms and KEGG pathways of DEGs.
| Category | Term | Description | Count | FDR |
| BP term | GO:0030198 | extracellular matrix organization | 37 | 7.04E-12 |
| BP term | GO:0051301 | cell division | 48 | 5.19E-11 |
| BP term | GO:0007067 | mitotic nuclear division | 36 | 9.96E-09 |
| BP term | GO:0042493 | response to drug | 32 | 1.46E-04 |
| BP term | GO:0007155 | cell adhesion | 39 | 0.001202 |
| BP term | GO:0008283 | cell proliferation | 30 | 0.018629 |
| BP term | GO:0008284 | positive regulation of cell proliferation | 35 | 0.022819 |
| BP term | GO:0055114 | oxidation-reduction process | 40 | 0.049558 |
| CC term | GO:0070062 | extracellular exosome | 182 | 4.41E-13 |
| CC term | GO:0005615 | extracellular space | 100 | 2.20E-09 |
| CC term | GO:0031012 | extracellular matrix | 37 | 3.28E-08 |
| CC term | GO:0005578 | proteinaceous extracellular matrix | 33 | 3.94E-07 |
| CC term | GO:0005576 | extracellular region | 104 | 7.80E-07 |
| CC term | GO:0005737 | cytoplasm | 253 | 4.58E-06 |
| CC term | GO:0005654 | nucleoplasm | 151 | 1.04E-05 |
| CC term | GO:0016020 | membrane | 117 | 6.30E-04 |
| CC term | GO:0005829 | cytosol | 163 | 7.39E-04 |
| CC term | GO:0005783 | endoplasmic reticulum | 48 | 0.026438 |
| CC term | GO:0009986 | cell surface | 34 | 0.039827 |
| CC term | GO:0048471 | perinuclear region of cytoplasm | 37 | 0.048493 |
| MF term | GO:0005515 | protein binding | 397 | 5.20E-05 |
| MF term | GO:0005509 | calcium ion binding | 50 | 0.00598 |
| KEGG pathway | hsa04110 | Cell cycle | 24 | 3.89E-07 |
| KEGG pathway | hsa04512 | ECM-receptor interaction | 20 | 3.89E-07 |
| KEGG pathway | hsa04510 | Focal adhesion | 21 | 0.01858 |
BP = biological process, CC = cellular composition, GO = gene ontology, KEGG = kyoto encyclopedia of genes and genomes, MF = molecular function.
3.3. Protein–protein interaction network construction and hub gene identification
Protein interactions among the DEGs were predicted with search tool for the retrieval of interacting genes tools. The PPI network for DEGs is demonstrated in Fig. 2, in which the upregulated genes were marked in red and the downregulated genes were marked in green. The hub genes were identified using the venn diagram web tool that was used to intersect the 4 groups of the top 20 genes evaluated by MCC, MNC, Degree, and Stress in the PPI network by the CytoHubba in Cytoscape software (Fig. 3). As the result, cyclin B1 (CCNB1), cyclin dependent kinase 1 (CDK1), aurora kinase A (AURKA), ubiquitin-conjugating enzyme E2C (UBE2C), cyclin A2 (CCNA2) and cell division cycle 20 (CDC20) were regarded as the hub genes. All of these hub genes were upregulated in ESCC.
Figure 2.
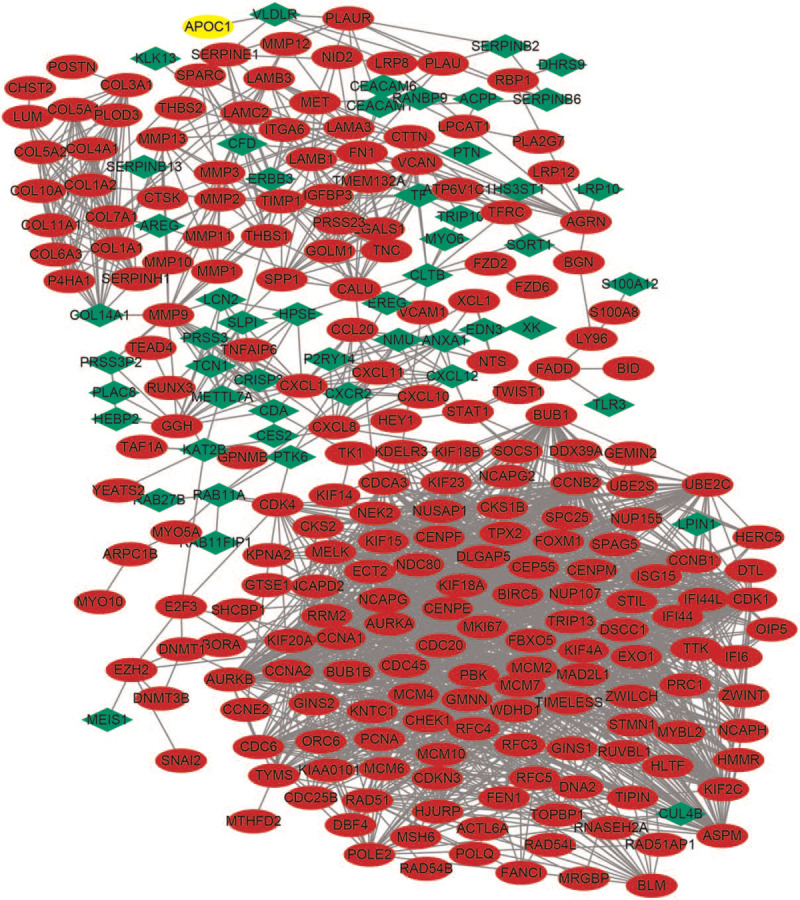
Protein–protein interaction network constructed with the differentially expressed genes. Note: Red nodes represent upregulated genes and green nodes represent downregulated genes.
Figure 3.
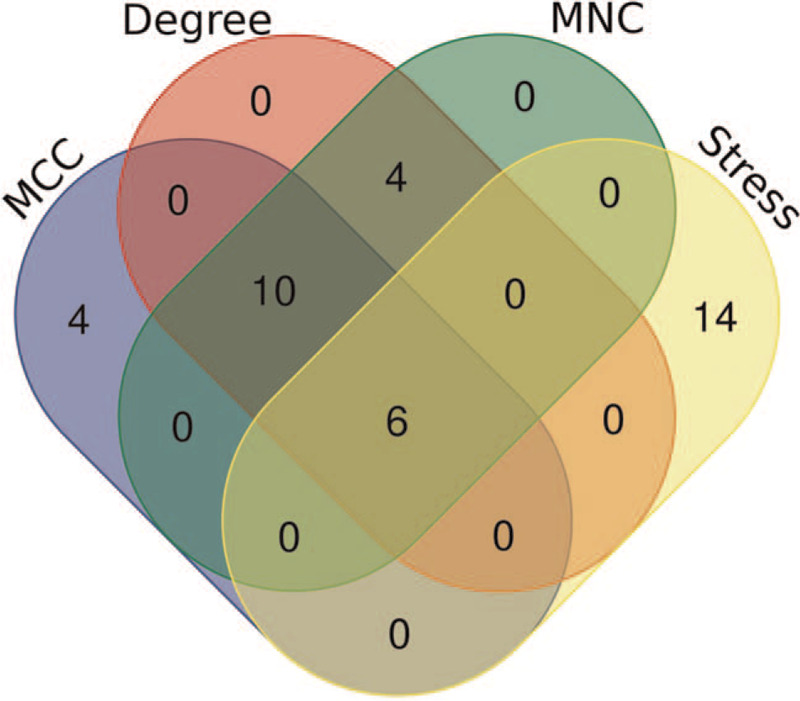
Venn diagram of the hub genes common to the 4 groups of the top 20 genes evaluated by MCC, MNC, Degree, and Stress by the cytoHubba in Cytoscape software. And we got 6 hub genes.
3.4. Checking of the hub genes
The hub genes were validated in another database ENCORI to confirm the outcomes (Fig, 4A). The outcomes were summarized in Table 4. The online database GEPIA were also used to confirm the expression of hub genes in ESCC (Fig. 4B). The both results indicated that the expression levels of CCNB1, CDK1, AURKA, UBE2C, CCNA2, and CDC20 were higher in ESCC tissues than in normal esophageal tissues. The data are consistent with our outcomes. Then, the analysis of the protein expression patterns of the Hub genes in ESCC were performed by utilizing data available from the Human Protein Atlas (Fig. 5). The results showed that the CCNB1 was highly expressed in ESCC tissues and mediumly expressed in normal esophageal tissues, that no expression of CDK1 was observed in normal tissues, while medium CDK1 gene expression was appreciated in tumor tissues, and that low gene expression of AURKA was observed in normal tissues and medium expression was observed in ESCC tissues. These results were similar to our outcomes. However, UBE2C were found to have medium expression in ESCC tissues, while high expression was observed in normal esophageal tissues. In addition, medium expression of CDC20 was observed in normal tissues, while low expression of CDC20 was observed in tumor tissues. In addition, low gene expression of CCNA2 was observed in normal tissues. Nevertheless, we did not find the result of CCNA2 in ESCC in HPA database. According to the current analysis, we predicted that CCNA2 might also be associated with ESCC, but experimental data were needed to confirm this specific connection.
Table 4.
Statistics of expression of the 6 hub genes in ENCORI database.
| Gene symbol | Cancer number | Normal number | Cancer exp | Normal exp | Fold change | P value | FDR |
| CCNB1 | 162 | 11 | 23.27 | 4.90 | 4.75 | 2.4e-18 | 2.1e-15 |
| CDK1 | 162 | 11 | 16.06 | 3.34 | 4.81 | 3.7e-20 | 6.7e-17 |
| AURKA | 162 | 11 | 13.33 | 2.77 | 4.82 | 7.2e-17 | 3.6e-14 |
| UBE2C | 162 | 11 | 49.12 | 8.37 | 5.87 | 6.5e-23 | 5.3e-19 |
| CCNA2 | 162 | 11 | 17.68 | 4.69 | 3.77 | 2.8e-17 | 1.7e-14 |
| CDC20 | 162 | 11 | 31.18 | 5.71 | 5.46 | 1.5e-21 | 6.1e-18 |
FDR = false discovery rate.
Figure 4.
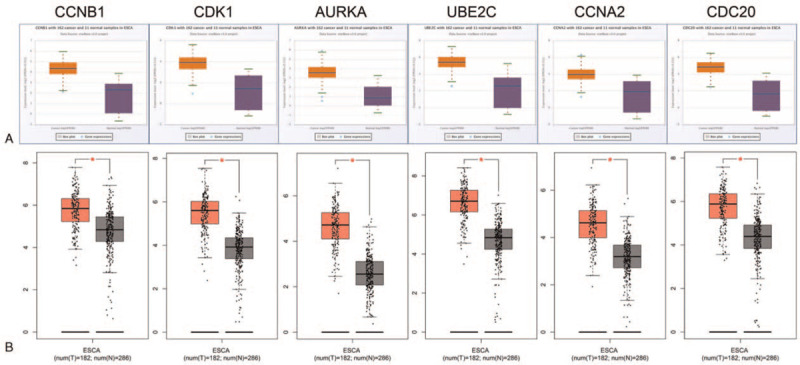
Analysis of messenger RNA (mRNA) levels of the hub genes in ESCC and normal tissues from the database ENCORI and GEPIA. (A): Level of mRNA of the hub genes from the database ENCORI; (B): Level of mRNA of the hub genes from the database GEPIA.
Figure 5.
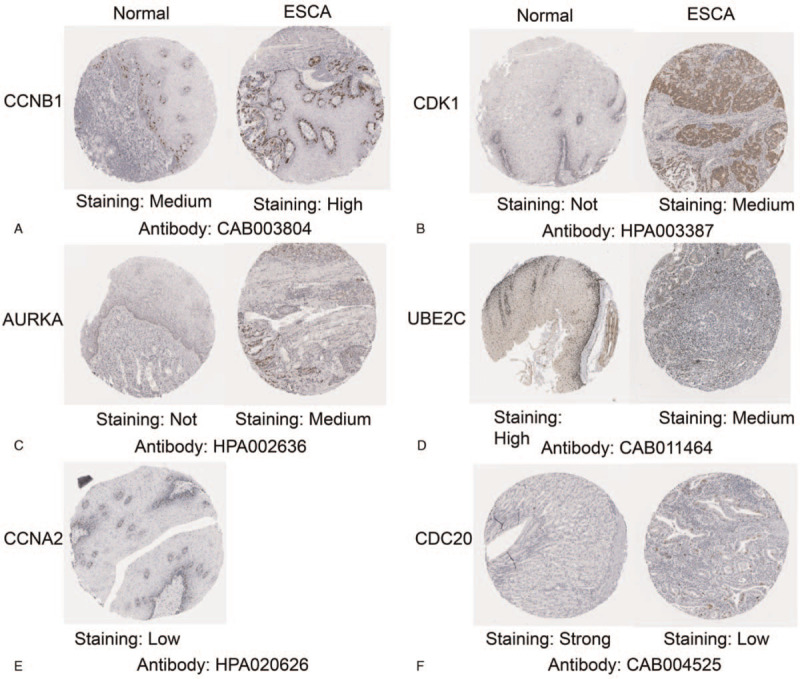
Validation the expression of the hub genes on translational level by the Human Protein Atlas database. (A) CCNB1, (B) CDK1, (C) AURKA, (D) UBE2C, (E) CCNA2, (F) CDC20. The staining strengths were annotated as not detected, Low, Medium and High.
3.5. Association of the hub genes with tumor stage, survival time of patients and tumor-infiltrating immune cells
We also analyzed the expression of the hub genes with tumor stage for ESCA. CCNB1 and CDC20 groups significantly varied, whereas AURKA, CCNA2, UBE2C, and CDK1 groups did not significantly differ (Fig. 6). ENCORI was used to analyze the correlation between the mRNA levels of the hub genes and the survival of patients with ESCA in 162 patients of ESCA. The results show that all of them did not have association with survival time of patients (Fig. 7A). Then, the online database GEPIA were also used to confirm the association of the hub genes with the OS and DFS of patients. The results were same with above (Fig. 7B,C). Based on the TIMER database, our current results demonstrated that all of the 6 hub genes were associated with tumor purity. However, CCNA2 and CDC20 were related to CD8+ T cell, and only CCNA2 was related to Neutrophil in ESCA. Except for CCNB1, all the other 5 hub genes are associated with Dendritic Cell (Fig. 8).
Figure 6.
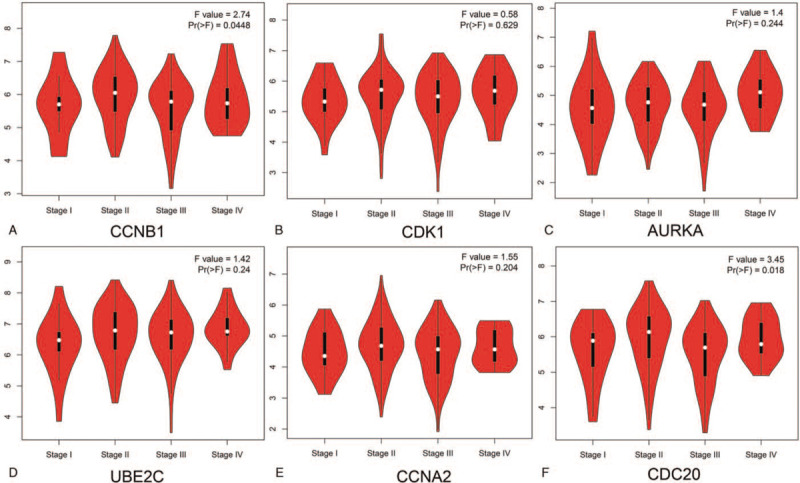
Correlation between expression of the hub genes and tumor stage in ESCA patients from GEPIA. Pr (>F) < .05 was considered statistically significant.
Figure 7.
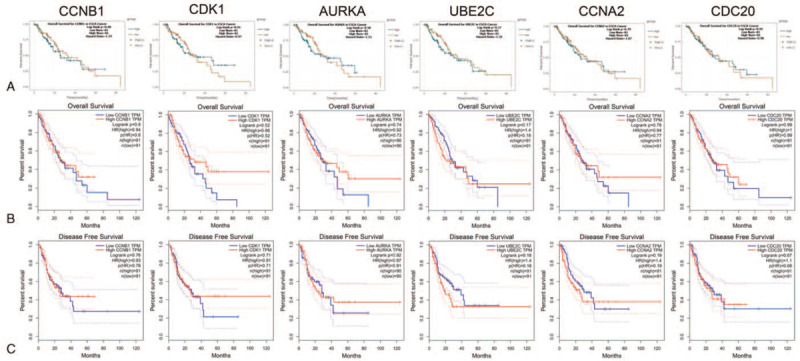
Prognostic value of 6 hub genes in ESCA. (A) Overall Survival for the hub genes in ENCORI database. The survival curve comparing the patients with high (green) and low (brown) expression in ESCA. (B) Overall Survival for the hub genes in GEPIA database. (C) Disease Free Survival for the hub genes in GEPIA database. The survival curve comparing the patients with high (red) and low (blue) expression in ESCA. P < .05 was considered statistically significant.
Figure 8.
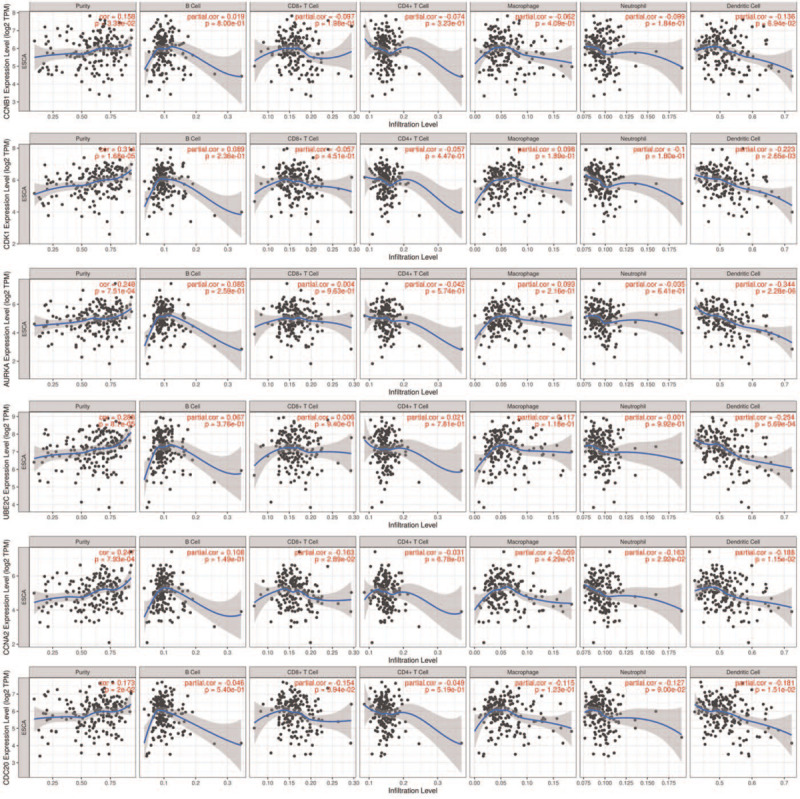
Correlation between hub genes expression and immune cell populations (B Cell, CD8+ T Cell, CD4+ T Cell, Macrophage, Neutrophil, and Dendritic Cell) in ESCA. P < .05 was considered statistically significant.
4. Discussion
Due to the differences of samples in various microarray studies, integrated analysis of various microarray datasets could obtain more accurate disease-related regulators with a larger sample size than an individual microarray. In our previous study, DEGs were identified in ESCC by integrated analysis of 3 microarray datasets with larger sample size. Above all, the hub genes in ESCC were further identified based these ESCC-related DEGs by integrated analysis of 4 methods of calculation. Finally, in this study, we have gotten 707 DEGs, including 385 upregulated genes and 322 downregulated genes and 6 genes were identified as the hub genes, which had the high connectivity with ESCC, including CCNB1, CDK1, AURKA, UBE2C, CCNA2, and CDC20. Novel insights and new research directions can be provided from our finding about the explanation of ESCC pathogenesis.
It is generally accepted that cell cycle dysregulation is closely related to the proliferation of cancer cells and is a hallmark of human cancer.[15] Progression of cell cycle is mediated by a series of cyclin-dependent kinases (CDKS) and cyclins. Cyclins play vital roles at various phases of the cell cycle by activating specific CDKS. Cyclin B1, encoded by the CCNB1 gene, has been demonstrated to play a key role in tumorigenesis and tumor development. Dysregulation of cyclin B1 can lead to unrestricted cell-cycle progression and malignant transformation.[16] A large number of studies have shown that cyclin B1 is associated with the differentiation, growth, apoptosis, metastasis and chemoresistance of cancer cell.[17–21] Overexpression of cyclin B1 has been reported in various human cancers, such as breast,[22] colorectal,[23] lung,[24] prostate,[25] pancreatic,[26] laryngeal,[27] esophageal,[17] gastric[28] and hepatocellular[29] cancers.
CDK1 is a serine/threonine protein kinase, that plays a key role in cell proliferation at the G2/M point of the cell cycle. Errors in the regulation mechanism of CDK1 directly lead to cell differentiation disorders, cell cycle disorders, malignant cell proliferation and abnormal transformation, and finally lead to the formation of malignant tumors.[30] Previous studies have found that CDK1 expression was higher in breast cancer,[31] oral squamous cell carcinoma,[32] cervical cancer[33] and gastric cancer[34] compared to normal tissues, and positively correlated with lymph node metastasis, differentiation, clinical stage and histopathological stage. Moreover, the expression of CDK1 in esophageal squamous cell carcinoma was significantly higher than that in normal esophageal tissues.[35]
AURKA is one of 3 highly homologous serine/threonine kinase families. As a cell cycle regulating kinase, it plays a key role in regulating many links of mitosis. Especially during the transition from G2 to M phase, the activity of AURKA increases significantly. Studies have reported that AURKA is closely related to the development of endometrial cancer,[36] colorectal adenocarcinoma,[37] oral cancer[38] and other malignant tumors.
UBE2C is considered to play an important role in the tumorigenesis of many cancers and to promote cell cycle progression. UBE2C is involved in tumorigenesis by regulating cell cycle, apoptosis, metastasis and transcription.[39] Overexpression of UBE2C has been reported in many tumors, such as NSCLC,[40] ovarian carcinoma,[41] rectal carcinoma,[42] prostate carcinomas,[43] breast carcinomas[44] and thyroid carcinomas.[45] Palumbo A Jr et al[46] reported that UBE2C affects proliferation rates and cell cycle profile of ESCC cell lines, by directly interfering with cyclin B1 protein levels, suggesting its involvement in crucial steps of ESCC carcinogenesis.
CCNA2 (as a cyclin in control of the cell cycle during the G2 to M phase transition by activation of CDK1 and CDK2[47]) is expressed in dividing somatic cells and overexpressed in human cancers,[48] including glioblastoma.[49] Therefore, Ccna2 is considered to be a kind of cancer kinesin.[50,51]
CDC20 appears to act as a regulatory protein interacting with several other proteins at multiple points in the cell cycle. Based on many bioinformatics studies, it has been identified as a key candidate gene in a variety of cancers.[52,53] High expression levels of CDC20 have been reported to be associated with poor prognosis for multiple tumors.[54,55]
In conclusion, our integrated analysis identified key genes in ESCC which provides clues for exploring the mechanism of ESCC. However, there are limitations in our study. Firstly, the number of the gene expression profiles was small and it was just 3. Secondly, only little clinical information of samples of these 3 datasets was used in our study. Hence, it is difficult to analyze the confounding effects of age, gender and histological differentiation on gene expression in ESCC. So it is farfetched that making the conclusion that all of them did not have association with survival time of patients. Thirdly, there were some differences of gene expression between the results of GEPIA and ENCORI and the results of The human protein atlas, so it is essential to do some experiments to verify again.
5. Conclusion
In our previous study, 707 DEGs (including 385 upregulated genes and 322 downregulated genes) and 6 hub genes (CCNB1, CDK1, AURKA, UBE2C, CCNA2, and CDC20) were identified. All of them were highly expressed in ESCC tissues. Among of them, only CCNB1 and CDC20 were associated with tumor stage and all of them were not associated with survival time of patients.
In this study, DEGs of ESCC was systemically analyzed and we provided a thorough, scientific and comprehensive research goals and directions for our future study.
Author contributions
Conceptualization: Xiaojie Yang, Mengyue Tian, Tianci Chai, Mingqiang Kang.
Data curation: Xiaojie Yang, Mengyue Tian, Tianci Chai.
Formal analysis: Xiaojie Yang, Mengyue Tian, Tianci Chai.
Funding acquisition: Zhimin Shen.
Investigation: Xiaojie Yang, Mengyue Tian, Tianci Chai.
Methodology: Xiaojie Yang, Mengyue Tian, Tianci Chai.
Project administration: Xiaojie Yang, Mengyue Tian, Weiguang Zhang, Tianci Chai.
Resources: Mengyue Tian, Mingqiang Kang, Jiangbo Lin, Zhimin Shen.
Software: Xiaojie Yang, Mengyue Tian, Weiguang Zhang, Tianci Chai.
Supervision: Mengyue Tian, Mingqiang Kang, Jiangbo Lin.
Validation: Xiaojie Yang, Mengyue Tian, Weiguang Zhang, Tianci Chai.
Visualization: Xiaojie Yang, Mengyue Tian, Tianci Chai.
Writing – original draft: Xiaojie Yang, Mengyue Tian, Tianci Chai, Zhimin Shen.
Writing – review & editing: Mengyue Tian.
Footnotes
Abbreviations: AURKA = aurora kinase A, CCNA2 = cyclin A2, CCNB1 = cyclin B1, CDC20 = cell division cycle 20, CDK1 = cyclin dependent kinase 1, DEGs = differently expressed genes, ENCORI = encyclopedia of RNA interactomes, ESCA = esophageal carcinoma, ESCC = esophageal squamous cell carcinoma, GEO = gene expression omnibus, GEPIA = gene expression profiling interactive analysis, GO = gene ontology, KEGG = kyoto encyclopedia of genes and genomes, MF = molecular function, PPI = protein–protein interaction, TIMER = tumor immune estimation resource, UBE2C = ubiquitin conjugating enzyme E2C.
How to cite this article: Yang X, Tian M, Zhang W, Chai T, Shen Z, Kang M, Lin J. Identification of potential core genes in esophageal carcinoma using bioinformatics analysis. Medicine. 2021;100:27(e26428).
XY and MT contributed equally to this work.
This work is supported by the Fujian Key Laboratory of Cardio-Thoracic Surgery (Fujian Medical University), the Fujian Province Major Science and Technology Program [2018YZ001–1], Start-up Fund for scientific research, Fujian Medical University (Grant No. 2017XQ1069, 2017XQ1032 and 2019QH1023), Joint Funds for the Innovation of Science and Technology, Fujian Province (Grant Number: 2018Y9034), Young and Middle-aged Teacher Project, Fujian Provincial Department of Education (Grant No.JAT190194). The funder will have no role in this study. The authors alone are responsible for the writing and content of this article.
The ethical statement: in this study, we did not involve any ethics issues. All of the data were freely available online, and this study did not involve any experiment on humans or animals performed by any of the authors.
The authors have no conflicts of interests to disclose.
The datasets generated during and/or analyzed during the current study are publicly available.
References
- [1].Bray F, Ferlay J, Soerjomataram I, Siegel RL, Torre LA, Jemal A. Global cancer statistics 2018: GLOBOCAN estimates of incidence and mortality worldwide for 36 cancers in 185 countries. CA 2018;68:394–424. [DOI] [PubMed] [Google Scholar]
- [2].Abnet CC, Arnold M, Wei W-Q. Epidemiology of esophageal squamous cell carcinoma. Gastroenterology 2018;154:360–73. [DOI] [PMC free article] [PubMed] [Google Scholar]
- [3].Domper Arnal MJ, Ferrandez Arenas A, Lanas Arbeloa A. Esophageal cancer: risk factors, screening and endoscopic treatment in Western and Eastern countries. World J Gastroenterol 2015;21:7933–43. [DOI] [PMC free article] [PubMed] [Google Scholar]
- [4].Lou F, Sima CS, Adusumilli PS, et al. Esophageal cancer recurrence patterns and implications for surveillance. J Thorac Oncol 2013;8:1558–62. [DOI] [PMC free article] [PubMed] [Google Scholar]
- [5].Clough E, Barrett T. The gene expression omnibus database. Methods Mol Biol 2016;1418:93–110. [DOI] [PMC free article] [PubMed] [Google Scholar]
- [6].Barrett T, Wilhite SE, Ledoux P, et al. NCBI GEO: archive for functional genomics data sets--update. Nucleic Acids Res 2013;41:D991–995. [DOI] [PMC free article] [PubMed] [Google Scholar]
- [7].Ashburner M, Ball C, Blake J, et al. Gene ontology: tool for the unification of biology. The gene ontology consortium. Nature genetics 2000;25:25–9. [DOI] [PMC free article] [PubMed] [Google Scholar]
- [8].Kanehisa M, Sato Y. KEGG Mapper for inferring cellular functions from protein sequences. Protein Sci 2020. [DOI] [PMC free article] [PubMed] [Google Scholar]
- [9].Huang dW, Sherman B, Lempicki R. Systematic and integrative analysis of large gene lists using DAVID bioinformatics resources. Nature Protocols 2009;4:44–57. [DOI] [PubMed] [Google Scholar]
- [10].Szklarczyk D, Franceschini A, Wyder S, et al. STRING v10: protein-protein interaction networks, integrated over the tree of life. Nucleic Acids Res 2015;43:D447–52. [DOI] [PMC free article] [PubMed] [Google Scholar]
- [11].Li JH, Liu S, Zhou H, et al. starBase v2.0: decoding miRNA-ceRNA, miRNA-ncRNA and protein-RNA interaction networks from large-scale CLIP-Seq data. Nucleic Acids Res 2014;42:D92–97. [DOI] [PMC free article] [PubMed] [Google Scholar]
- [12].Tang Z, Li C, Kang B, et al. GEPIA: a web server for cancer and normal gene expression profiling and interactive analyses. Nucleic Acids Res 2017;45:W98–102. [DOI] [PMC free article] [PubMed] [Google Scholar]
- [13].Ponten F, Schwenk JM, Asplund A, et al. The human protein atlas as a proteomic resource for biomarker discovery. J Intern Med 2011;270:428–46. [DOI] [PubMed] [Google Scholar]
- [14].Li T, Fu J, Zeng Z, et al. TIMER2.0 for analysis of tumor-infiltrating immune cells. Nucleic Acids Res 2020;48:W509–14. [DOI] [PMC free article] [PubMed] [Google Scholar]
- [15].Sherr C. Cancer cell cycles. Science (New York, NY) 1996;274:1672–7. [DOI] [PubMed] [Google Scholar]
- [16].Sartor H, Ehlert F, Grzeschik K, et al. Assignment of two human cell cycle genes, CDC25C and CCNB1, to 5q31 and 5q12, respectively. Genomics 1992;13:911–2. [DOI] [PubMed] [Google Scholar]
- [17].Song Y, Zhao C, Dong L, et al. Overexpression of cyclin B1 in human esophageal squamous cell carcinoma cells induces tumor cell invasive growth and metastasis. Carcinogenesis 2008;29:307–15. [DOI] [PubMed] [Google Scholar]
- [18].Matthess Y, Raab M, Sanhaji M, et al. Cdk1/cyclin B1 controls Fas-mediated apoptosis by regulating caspase-8 activity. Molecular Cellular Biol 2010;30:5726–40. [DOI] [PMC free article] [PubMed] [Google Scholar]
- [19].Kedinger V, Meulle A, Zounib O, et al. Sticky siRNAs targeting survivin and cyclin B1 exert an antitumoral effect on melanoma subcutaneous xenografts and lung metastases. BMC Cancer 2013;13:338. [DOI] [PMC free article] [PubMed] [Google Scholar]
- [20].Bonnet M, Gossart J, Benoit E, et al. Systemic delivery of sticky siRNAs targeting the cell cycle for lung tumor metastasis inhibition. J Controlled Release 2013;170:183–90. [DOI] [PubMed] [Google Scholar]
- [21].Gomez L, de Las Pozas A, Reiner T, et al. Increased expression of cyclin B1 sensitizes prostate cancer cells to apoptosis induced by chemotherapy. Molecular Cancer Therapeutics 2007;6:1534–43. [DOI] [PubMed] [Google Scholar]
- [22].Agarwal R, Gonzalez-Angulo A, Myhre S, et al. Integrative analysis of cyclin protein levels identifies cyclin b1 as a classifier and predictor of outcomes in breast cancer. Clin Cancer Res 2009;15:3654–62. [DOI] [PMC free article] [PubMed] [Google Scholar]
- [23].Li J, Kubo A, Wu F, et al. Cyclin B1, unlike cyclin G1, increases significantly during colorectal carcinogenesis and during later metastasis to lymph nodes. Int J Oncol 2003;22:1101–10. [PubMed] [Google Scholar]
- [24].Soria J, Jang S, Khuri F, et al. Overexpression of cyclin B1 in early-stage non-small cell lung cancer and its clinical implication. Cancer Res 2000;60:4000–4. [PubMed] [Google Scholar]
- [25].Mashal R, Lester S, Corless C, et al. Expression of cell cycle-regulated proteins in prostate cancer. Cancer Res 1996;56:4159–63. [PubMed] [Google Scholar]
- [26].Zhou L, Li J, Zhao Y, et al. The prognostic value of Cyclin B1 in pancreatic cancer. Medical Oncol (Northwood, London, England) 2014;31:107. [DOI] [PubMed] [Google Scholar]
- [27].Dong Y, Sui L, Watanabe Y, Sugimoto K, Tokuda M. Clinical relevance of cyclin B1 overexpression in laryngeal squamous cell carcinoma. Cancer Lett 2002;177:13–9. [DOI] [PubMed] [Google Scholar]
- [28].Begnami M, Fregnani J, Nonogaki S, Soares F. Evaluation of cell cycle protein expression in gastric cancer: cyclin B1 expression and its prognostic implication. Human Pathol 2010;41:1120–7. [DOI] [PubMed] [Google Scholar]
- [29].Weng L, Du J, Zhou Q, et al. Identification of cyclin B1 and Sec62 as biomarkers for recurrence in patients with HBV-related hepatocellular carcinoma after surgical resection. Molecular Cancer 2012;11:39. [DOI] [PMC free article] [PubMed] [Google Scholar]
- [30].Sisinni L, Maddalena F, Condelli V, et al. TRAP1 controls cell cycle G2-M transition through the regulation of CDK1 and MAD2 expression/ubiquitination. J Pathol 2017;243:123–34. [DOI] [PubMed] [Google Scholar]
- [31].Galindo-Moreno M, Giráldez S, Sáez C, Japón M, Tortolero M, Romero F. Both p62/SQSTM1-HDAC6-dependent autophagy and the aggresome pathway mediate CDK1 degradation in human breast cancer. Scientific Rep 2017;7:10078. [DOI] [PMC free article] [PubMed] [Google Scholar]
- [32].Chang J, Wang H, Chang K, et al. Identification of differentially expressed genes in oral squamous cell carcinoma (OSCC): overexpression of NPM, CDK1 and NDRG1 and underexpression of CHES1. Int J Cancer 2005;114:942–9. [DOI] [PubMed] [Google Scholar]
- [33].Luo Y, Wu Y, Peng Y, Liu X, Bie J, Li S. Systematic analysis to identify a key role of CDK1 in mediating gene interaction networks in cervical cancer development. Irish J Med Sci 2016;185:231–9. [DOI] [PubMed] [Google Scholar]
- [34].Lee M, Cho Y, Kim D, et al. Menadione induces G2/M arrest in gastric cancer cells by down-regulation of CDC25C and proteasome mediated degradation of CDK1 and cyclin B1. Am J Translat Res 2016;8:5246–55. [PMC free article] [PubMed] [Google Scholar]
- [35].Fu S, Jin L, Gong T, et al. Effect of sinomenine hydrochloride on radiosensitivity of esophageal squamous cell carcinoma cells. Oncology Rep 2018;39:1601–8. [DOI] [PMC free article] [PubMed] [Google Scholar]
- [36].Townsend M, Ence Z, Felsted A, et al. Potential new biomarkers for endometrial cancer. Cancer Cell Int 2019;19:19. [DOI] [PMC free article] [PubMed] [Google Scholar]
- [37].Jacobsen A, Bosch L, Martens-de Kemp S, et al. Aurora kinase A (AURKA) interaction with Wnt and Ras-MAPK signalling pathways in colorectal cancer. Scientific Rep 2018;8:7522. [DOI] [PMC free article] [PubMed] [Google Scholar]
- [38].Huang C, Wang L, Song H, et al. AURKA interactive effects of polymorphisms with smoking on the susceptibility of oral cancer. Artificial Cells, Nanomedicine Biotechnol 2019;47:2333–7. [DOI] [PubMed] [Google Scholar]
- [39].Liu G, Zhao J, Pan B, Ma G, Liu L. UBE2C overexpression in melanoma and its essential role in G2/M transition. J Cancer 2019;10:2176–84. [DOI] [PMC free article] [PubMed] [Google Scholar]
- [40].Jin D, Guo J, Wu Y, et al. UBE2C, directly targeted by miR-548e-5p, increases the cellular growth and invasive abilities of cancer cells interacting with the EMT marker protein zinc finger E-box binding homeobox 1/2 in NSCLC. Theranostics 2019;9:2036–55. [DOI] [PMC free article] [PubMed] [Google Scholar] [Retracted]
- [41].Gong Y, Wang D, Lin L, Dai J, Yu L. The expression of ubiquitin-conjugating enzyme E2C and KAI1 in ovarian carcinoma and their clinical significance. Medicine 2019;98:e17896. [DOI] [PMC free article] [PubMed] [Google Scholar]
- [42].Zhang Y, Tian S, Li X, Ji Y, Wang Z, Liu C. UBE2C promotes rectal carcinoma via miR-381. Cancer Biol Therapy 2018;19:230–8. [DOI] [PMC free article] [PubMed] [Google Scholar]
- [43].Wang H, Zhang C, Rorick A, et al. CCI-779 inhibits cell-cycle G2-M progression and invasion of castration-resistant prostate cancer via attenuation of UBE2C transcription and mRNA stability. Cancer Res 2011;71:4866–76. [DOI] [PMC free article] [PubMed] [Google Scholar]
- [44].Berlingieri M, Pallante P, Sboner A, et al. UbcH10 is overexpressed in malignant breast carcinomas. Eur J Cancer (Oxford, England: 1990) 2007;43:2729–35. [DOI] [PubMed] [Google Scholar]
- [45].Pallante P, Berlingieri M, Troncone G, et al. UbcH10 overexpression may represent a marker of anaplastic thyroid carcinomas. Br J Cancer 2005;93:464–71. [DOI] [PMC free article] [PubMed] [Google Scholar]
- [46].Palumbo A, Da Costa N, De Martino M, et al. UBE2C is overexpressed in ESCC tissues and its abrogation attenuates the malignant phenotype of ESCC cell lines. Oncotarget 2016;7:65876–87. [DOI] [PMC free article] [PubMed] [Google Scholar]
- [47].Bendris N, Lemmers B, Blanchard J, Arsic N. Cyclin A2 mutagenesis analysis: a new insight into CDK activation and cellular localization requirements. PloS One 2011;6:e22879. [DOI] [PMC free article] [PubMed] [Google Scholar]
- [48].Yam C, Fung T, Poon R. Cyclin A in cell cycle control and cancer. Cellular Mol Life Sci 2002;59:1317–26. [DOI] [PMC free article] [PubMed] [Google Scholar]
- [49].Doan P, Musa A, Candeias N, Emmert-Streib F, Yli-Harja O, Kandhavelu M. Alkylaminophenol induces G1/S phase cell cycle arrest in glioblastoma cells through p53 and cyclin-dependent kinase signaling pathway. Frontiers Pharmacol 2019;10:330. [DOI] [PMC free article] [PubMed] [Google Scholar]
- [50].Nault J, Datta S, Imbeaud S, et al. Recurrent AAV2-related insertional mutagenesis in human hepatocellular carcinomas. Nature Genetics 2015;47:1187–93. [DOI] [PubMed] [Google Scholar]
- [51].Shekhar R, Priyanka P, Kumar P, et al. The microRNAs miR-449a and miR-424 suppress osteosarcoma by targeting cyclin A2 expression. J Biological Chem 2019;294:4381–400. [DOI] [PMC free article] [PubMed] [Google Scholar]
- [52].Wang L, Li S, Wang Y, et al. Identification of differentially expressed protein-coding genes in lung adenocarcinomas. Experimental Therapeutic Med 2020;19:1103–11. [DOI] [PMC free article] [PubMed] [Google Scholar]
- [53].Tang J, Lu M, Cui Q, et al. Overexpression of ASPM, CDC20, and TTK confer a poorer prognosis in breast cancer identified by gene co-expression network analysis. Frontiers Oncol 2019;9:310. [DOI] [PMC free article] [PubMed] [Google Scholar]
- [54].Yang D, He Y, Wu B, et al. Integrated bioinformatics analysis for the screening of hub genes and therapeutic drugs in ovarian cancer. J Ovarian Res 2020;13:10. [DOI] [PMC free article] [PubMed] [Google Scholar]
- [55].Wu W, Hu K, Wang D, et al. CDC20 overexpression predicts a poor prognosis for patients with colorectal cancer. J Translat Med 2013;11:142. [DOI] [PMC free article] [PubMed] [Google Scholar]


