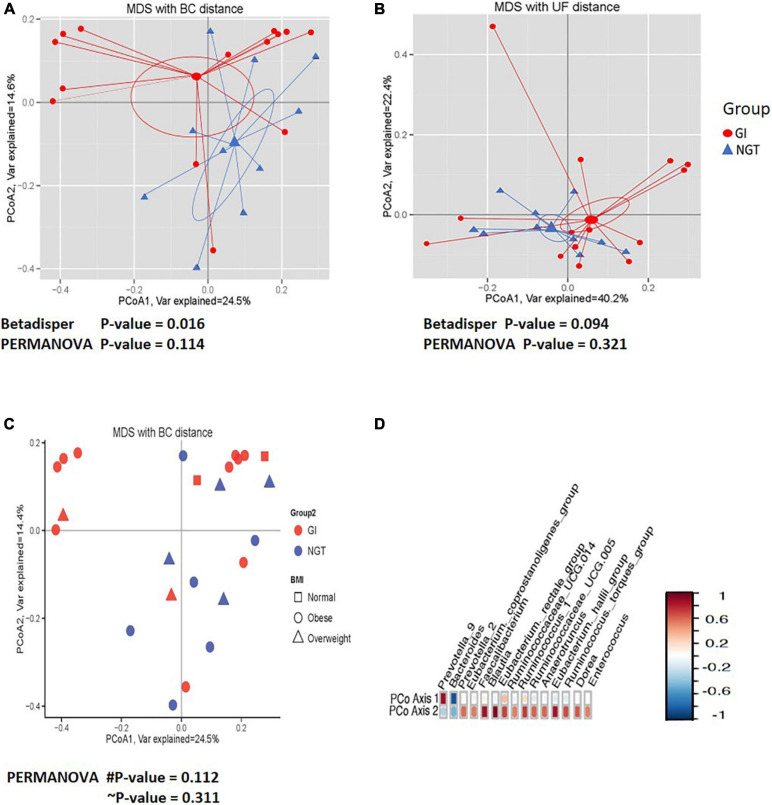
FIGURE 3.
The comparisons of the gut microbiota community (β diversity) between GI (red circle) and NGT (blue) groups. (A) Principal coordinate analysis (PCoA) plot based on the OTUs relative abundance using the Bray–Curtis (BC) distance. (B) PCoA plot based on the phylogenetic relationship using the UniFrac (UF) distance. The larger shapes are the centroids and linear lines are connected from the samples to the centroid for each group. (C) PCoA plot based on the OTUs relative abundance using the BC distance according to the BMI classification [normal (square), overweight (triangle), and obese (circle)] between GI (red circle) and NGT (blue) groups. PCoA1 and PCoA2 account for the horizontal and the vertical variances, respectively. The symbol # indicates p-value for comparison between GI and NGT groups. The symbol ∼ indicates p-value for comparison between BMI status. p-value < 0.05 was considered as statistically significant. (D) Correlation plot showing the OTUs with the high correlation with first (PCoA1) and second (PCoA2) axes. The red color indicates a positive correlation and the blue color indicates a negative correlation. GI, glucose intolerance; NGT, normal glucose tolerance; MDS, multidimensional scaling; BMI, body mass index; OTU, operational taxonomic unit.

