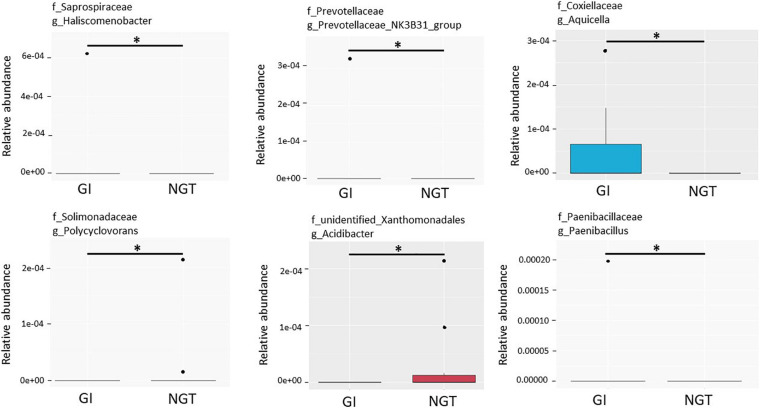
FIGURE 5.
Box plots showing the top six relative abundance of the genera that significantly differed between GI and NGT groups using metastats corrected by the Benjamini–Hochberg method. The box represents the interquartile range (IQR), the inside line represents the median, the whisker represents values within 1.5 × IQR of the first and third quartile, and the circle represents the outliers. ∗Genera with q-value < 0.05 were considered statistically significant. GI, glucose intolerance; NGT, normal glucose tolerance.

