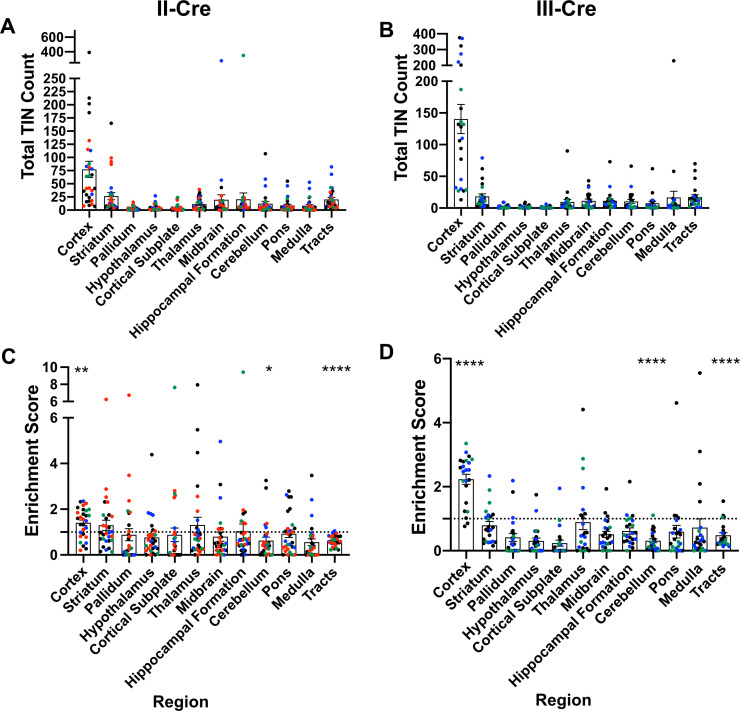
Figure 1. Toxoplasma-injected neurons (TINs) show a predilection for the cortex at 3 weeks post-infection.
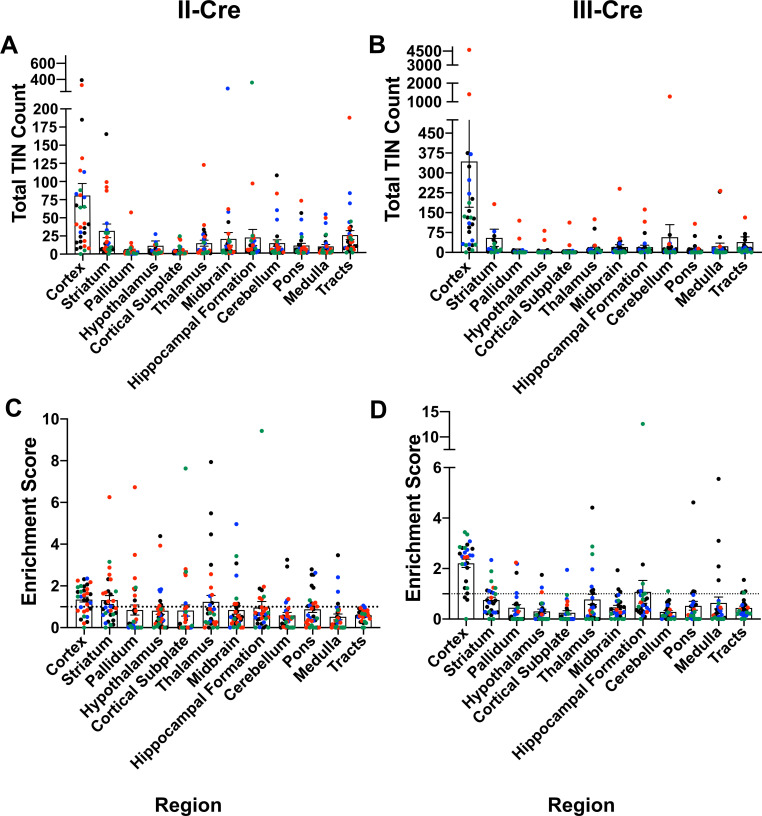
Cre-reporter mice were infected with II-Cre or III-Cre Toxoplasma parasites as indicated. Brains were harvested, sectioned, labeled, and quantified as previously described (Mendez et al., 2018). (A, B) Graphs of the absolute numbers of TINs mapped to 12 regions of the brain. (C, D) Graphs of TINs/region normalized to the size of the region. The dashed line is 1, the value at which the distribution of TINs would be considered proportional to the region size. Bars, mean ± SEM. N = 16–19/sections/mouse. Individual colors denote animals from individual cohorts, N = 4–12 mice/cohort for II-Cre infected mice, 2–11 mice/cohort for III-Cre infected mice. (C, D) *p=0.0170, **p=0.0021, ****p≤0.0001, one-sample t-test. p-Values for all regions are in Supplementary file 2. Mice were excluded from analyses if GFP+ cells were not above background rate of GFP+ cells in saline-injected Cre reporter mice or if identified as an outlier by ROUT outlier test, which exclude both Cohort 1 (red) III-Cre infected mice. Figure 1—figure supplement 1 includes all mice and uses all Allen Institute sections for normalization/enrichment index.


