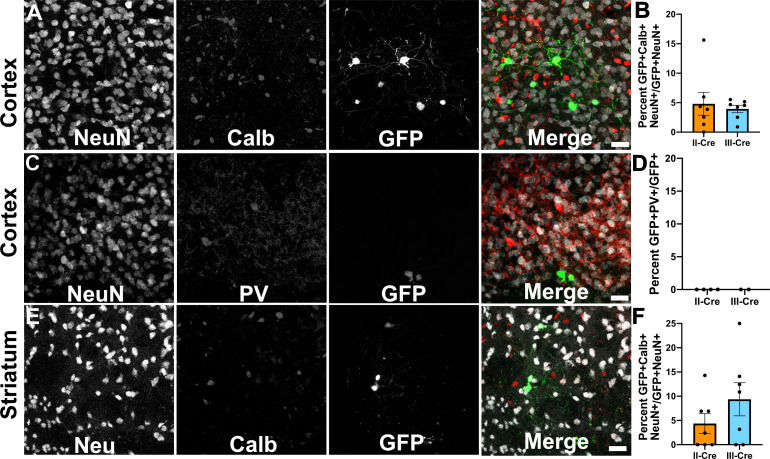
Figure 2. Toxoplasma-injected neurons (TINs) rarely co-localize with inhibitory interneurons.
Forty micron brain sections from II-Cre or III-Cre infected mice were stained with anti-NeuN antibodies and either anti-calbindin or anti-parvalbumin antibodies. Stained sections were then imaged by confocal microscopy to determine co-localization between TINs (GFP+) and calbindin (Calb) or parvalbumin (PV) staining. (A) Representative images of a cortical region from a section stained for Calb. (B) Quantification of the percentage of TINs that co-localized with Calb staining. (C) As in (A) except the images are of a cortical region stained for PV. (D) As in (B) except for PV quantification. (E) As in (A), but in the striatum. (F) As in (B) except for striatal Calb quantification. For (A, C, E) Merge images, gray = NeuN, red = Calb or PV, and green = GFP. N = 9 sections/mouse, seven mice/group for Calb, 2–4 mice/group for PV. (B, D, F) Bars, mean ± SEM. (B) For II-Cre infected mice, 24–127 TINs/mouse were analyzed; for III-Cre infected mice, 254–503 TINs/mouse were analyzed. (D) For II-Cre, 8–68 TINs/mouse, and for III-Cre, 281, 346 TINs/mouse were analyzed. (F) For II-Cre infected mice, 3–290 TINs/mouse were analyzed; for III-Cre infected mice, 21–214 TINs/mouse were analyzed. No significant differences were identified between groups, Student’s t-test.

