. 2021 Jun 9;10:e67681. doi: 10.7554/eLife.67681

Figure 3. Toxoplasma-injected neurons (TINs) co-localize with FoxP2 and DARPP32 staining.

Brain sections from II-Cre or III-Cre infected mice were stained with anti-NeuN antibodies and anti-FoxP2 or anti-DARPP32 antibodies. DARPP32 staining was only done in the striatum. Stained sections were then analyzed by confocal microscopy to determine co-localization between TINs (GFP+) and FoxP2 or DARPP32 staining. (A) Representative image of a cortical region from a section stained as labeled. (B) Quantification of the percentage of TINs that co-localized with FoxP2 staining. (C) As in (A) except the images are of a striatal region. (D) As in (B) except for striatal TINs. (E) As in (C) except the tissue is stained with anti-DARPP32 antibodies (as labeled). (F) As in (D) except co-localization is between TINs and DARPP32 staining. (A, C, E) Merge images, gray = NeuN, red = FoxP2 or DARPP32, and green = GFP. Scale bar = 50 µm. (B, D, F) Bars, mean ± SEM. For (B, D, F) N = 9 sections/mouse, seven mice/group. (B) For II-Cre infected mice, a total of 24–127 TINs/mouse were analyzed; for III-Cre infected mice, 254–503 TINs/mouse were analyzed. (D) For II-Cre infected mice, a total of 28–68 TINs/mouse were analyzed; for III-Cre infected mice, 290–858 TINs/mouse were analyzed. (F) For II-Cre infected mice, 6–237 TINs/mouse were analyzed; for III-Cre infected mice, 16–198 TINs/mouse were analyzed. No significant differences were identified between groups, Student’s t-test.

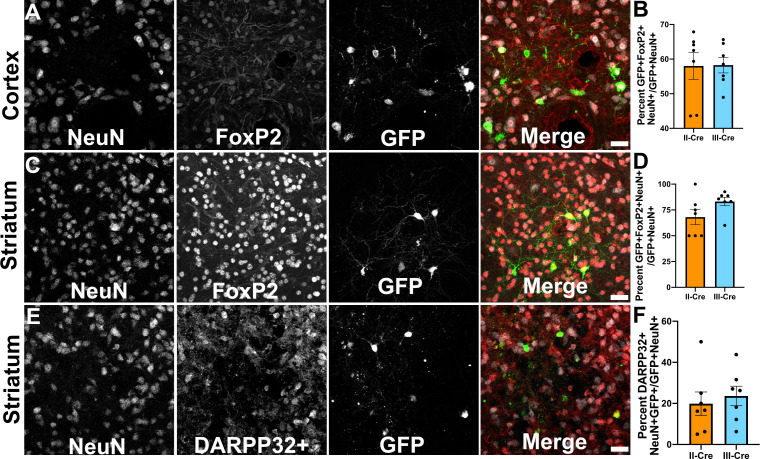
Figure 3—source data 1. Raw numbers for quantification of DARPP32+ cells.
Figure 3—source data 2. Raw numbers for quantification of FoxP2+ cells.

Figure 3.

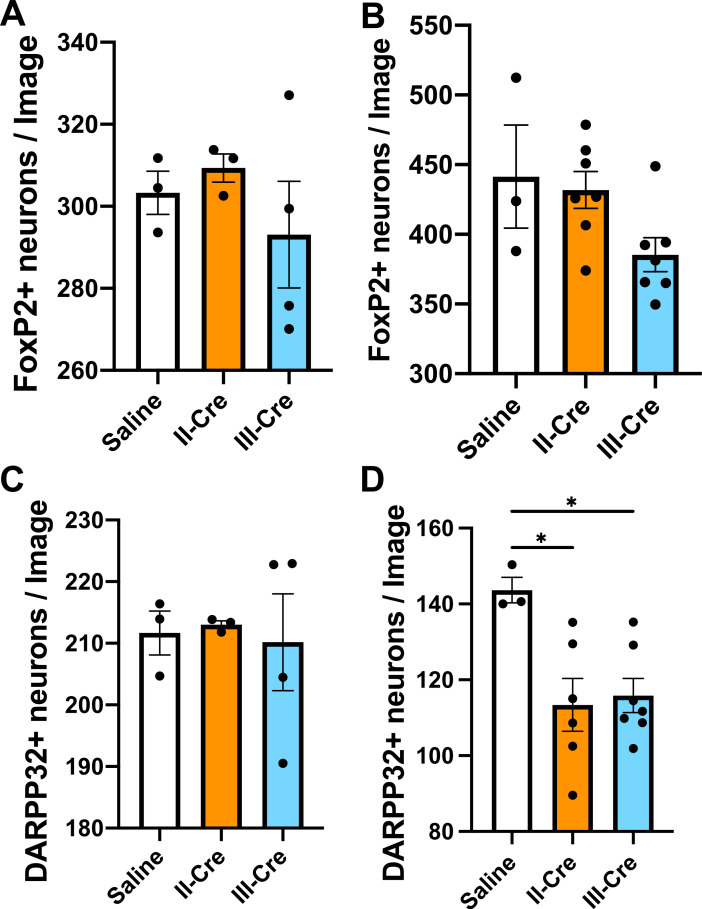
Figure 3—figure supplement 1. Quantification of FoxP2+ or DARPP32+neurons in the striatum.

Figure 3—figure supplement 1.

Brain sections from saline or II-Cre or III-Cre inoculated mice were stained with anti-NeuN antibodies and anti-FoxP2 or anti-DARPP32 antibodies. Stained sections were then analyzed for the number of FoxP2+ or DARPP32+ neurons. (A) Average number of FoxP2+ neurons/image when randomly sampling the striatum. (B) Average number of FoxP2+ neurons when sampling near TINs. (C) As in (A), but for DARPP32+ neurons (random sampling). (D) As in (B) but for DARPP32+ neurons (near TINs). Bars, mean ± SEM. N = 9 sections/mouse, 31–44 images/mouse, 3–7 mice/group. *p<0.05, one-way ANOVA with Dunnett’s post-test.
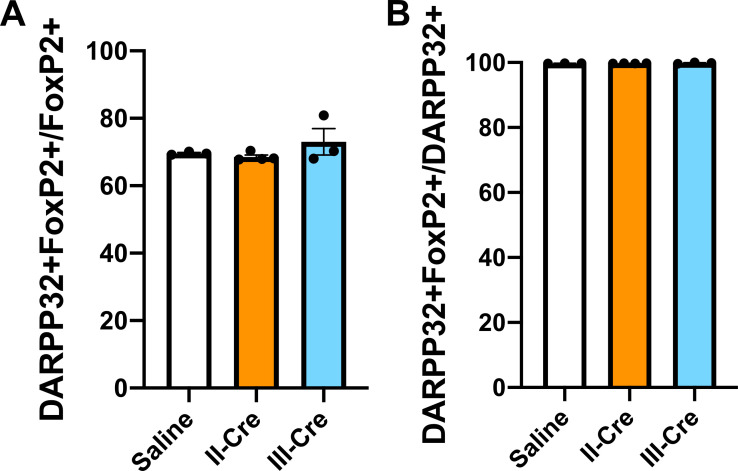
Figure 3—figure supplement 2. Baseline quantification for DARPP32+ and FoxP2+co-localization in the striatum.

Figure 3—figure supplement 2.

Brain sections from saline, II-Cre, or III-Cre inoculated mice were stained for both FoxP2 and DARPP32. (A) Percentage of FoxP2+ neurons that co-localize with DARPP32 labeling. (B) Percentage of DARPP32+ neurons that co-localize with FoxP2 labeling. Bars, mean ± SEM. N = 9 sections/mouse, 31–44 images/mouse, 3–4 mice/group. No significant differences were identified between groups, one-way ANOVA with Dunnett’s post-test.