. 2021 Jun 9;10:e67681. doi: 10.7554/eLife.67681

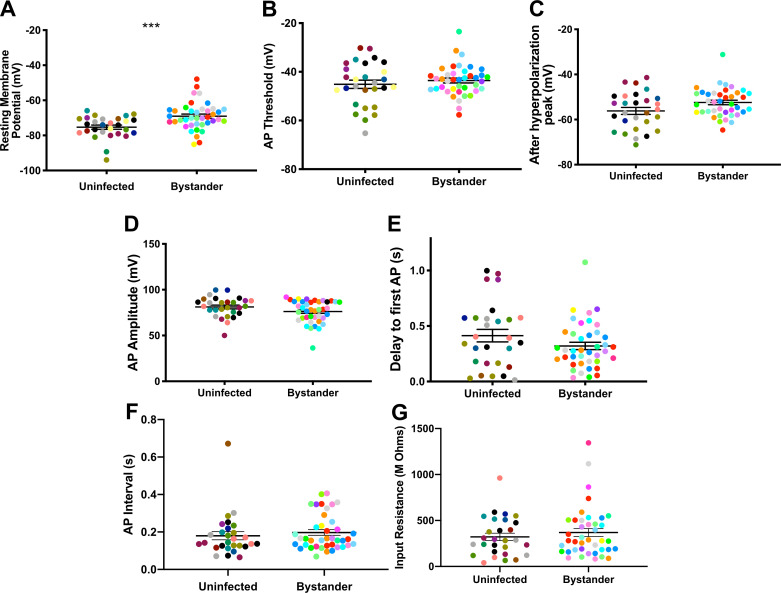
Figure 5. Bystander medium spiny neurons (MSNs) show similar electrophysiology as MSNs from uninfected mice.

(A) Graph of the resting membrane potential of whole cell patch clamped MSNs in uninfected mice (−74.9 ± 2.1 mV) and bystander MSNs in infected mice (−68.7 ± 4.0 mV). (B) Action potential (AP) threshold, (C) after hyperpolarization peak, (D) AP amplitude, (E) delay to first AP, (F) AP interval, and (G) input resistance in MSNs from uninfected mice and bystander MSNs in infected mice. Dots represent individual MSNs. Matching color dots denote cells from the same mouse. Uninfected MSNs, N = 28 cells recorded from 14 mice, 1–5 cells recorded/mouse. Bystander MSNs, N = 40 cells recorded from 18 mice, 1–5 cells recorded/mouse. Line, mean ± SEM. ***p=0.0007, Mann-Whitney U-test.

Figure 5—source data 1. Raw electrophysiology recording data for MSNs from uninfected mice and bystander MSNs and TINs from infected mice (source data for Figures 5 and 6A).

Figure 5.

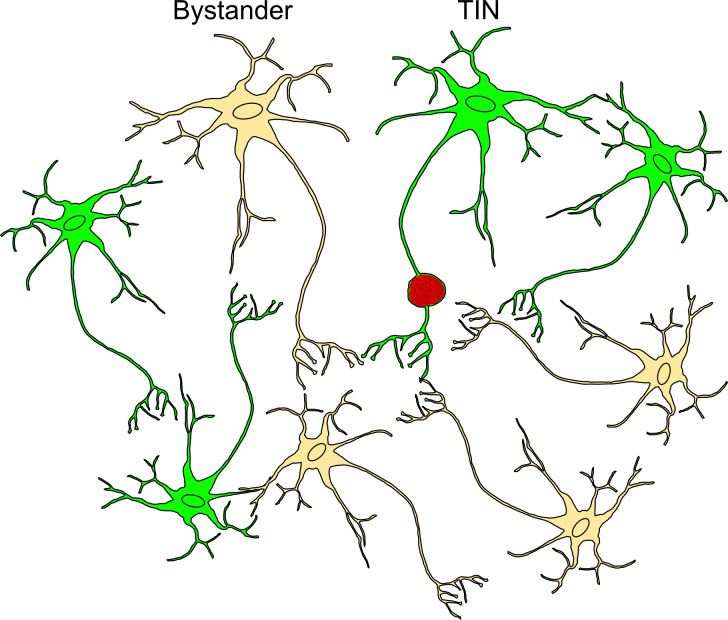
Figure 5—figure supplement 1. Schematic of bystander and Toxoplasma-injected neurons (TINs) during recording procedure.

Figure 5—figure supplement 1.

Bystander neurons are neurons that are in the same inflammatory microenvironment as TINs but have not been injected with Toxoplasma protein. TINs (GFP+) include both infected and uninfected neurons, with over 90% of TINs not harboring parasites (Koshy et al., 2012). During recordings, no TINs with a cyst were observed. Bystanders = beige neuron, TINs = green neuron, red vacuole = Toxoplasma cyst.
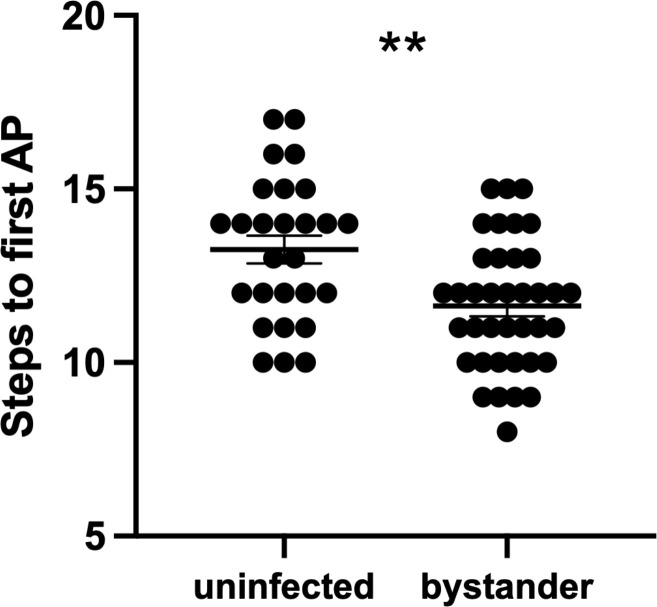
Figure 5—figure supplement 2. Bystander medium spiny neurons (MSNs) fire the first action potential (AP) sooner than MSNs from uninfected controls.

Figure 5—figure supplement 2.

To initiate AP firing in patch-clamped neurons, 20 steps of both hyperpolarizing and depolarizing current are injected into a patched neuron (Wang et al., 2019). The graph shows the step number at which each neuron fired its first AP. Dots represent individual MSNs. Lines, mean ± SEM. **p=0.0014 by unpaired two-tailed Student’s t-test.
Figure 5—figure supplement 2—source data 1. Raw data for the number of steps quantified to reach first action potential.