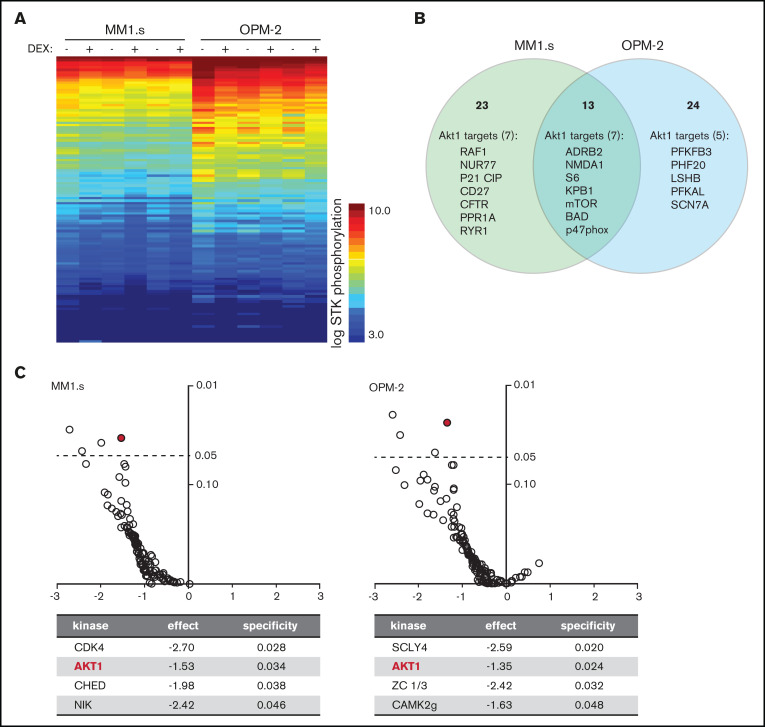
Figure 2.
Exposure of HMCLs to dexamethasone (DEX) reduces phosphorylation of Akt1 substrates. (A) Heatmap showing STK phosphorylation of peptides in lysates of MM1.s and OPM-2 exposed to 1 μM DEX or dimethyl sulfoxide (DMSO) control for 4 hours. Columns represent 3 technical triplicates per HMCL and treatment condition. Every row represents a unique peptide motif. The log STK phosphorylation is indicated by a color scale in which low phosphorylated peptides are indicated by blue and high phosphorylated peptides by orange/red. (B) Venn diagram depicting total number of peptides with statistically significant reduced phosphorylation in DEX-treated MM1.s (23 unique hits) and OPM-2 (24 unique hits; 13 hits shared between both HMCLs), compared with control cells. Significant hits belonging to Akt1 downstream substrates are specified per HMCL (7 of 23 unique hits for MM1s; 5 of 24 unique hits for OPM-2; 7 of 13 hits shared between both HMCLs). Original data are provided in supplemental Figure 4. (C) Volcano plot of predicted STK activity based on statistically significant dexamethasone-mediated reduction of peptide phosphorylation as shown in supplemental Figure 4, showing fold-difference (x-axis) and specificity (y-axis). Statistical significance with a P value <.05 is indicated by the dashed line. Details are provided for the significant STK’s per HMCL. Akt1 is indicated by the red mark.

