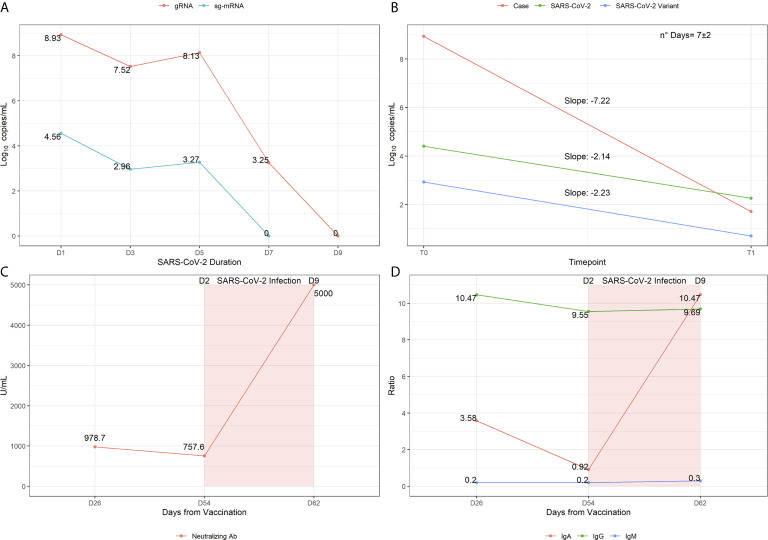
Figure 1.
Virological and immunological profiling showing the infection trajectory observed in the patient. (A) Sars-CoV-2 genomic RNA and sg-mRNA component expressed in log10copies/mL are reported for each molecular test performed during the time of infection. (B) Slopes representation indicating the speed of temporal decay observed in the patient compared to reference samples, with wild-type or variant Sars-CoV-2. (C) Titers of Anti-Sars-CoV-2 RBD antibodies (i.e neutralizing Abs) measured 26 days post vaccination, 54 days post vaccination (day 2 post infection) and 62 days post vaccination (day 9 post infection). (D) Assessment of Antibodies subpopulations ratios measured at the three time-points of interest.

