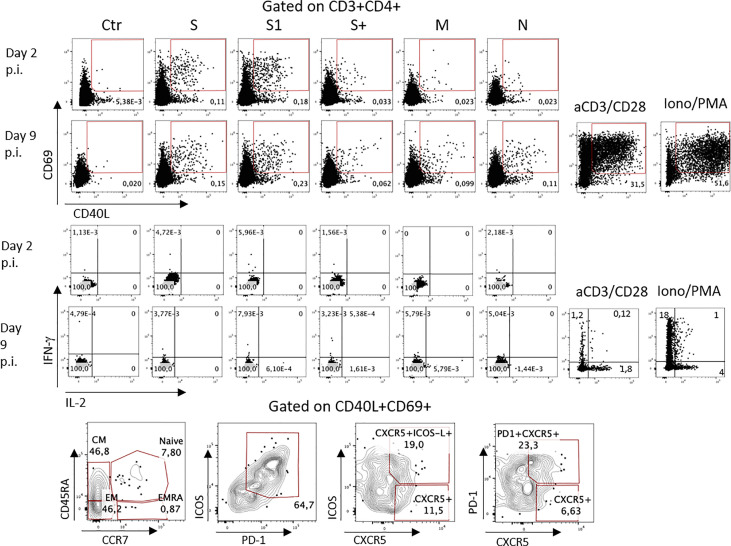
Figure 2.
SARS-CoV2-specific CD4 T cell responses. (1) Surface expression of activation markers CD69 and CD40L by CD4 cells stimulated with peptide pools from the different viral antigens. Numbers indicate percentages of positive cells within each gate. (2) IFN-γ and IL-2 production by antigen-specific CD4 cells. Bottom: phenotype of S-specific CD4+ T cells. Ab: Antibodies. p.i: post infection.

