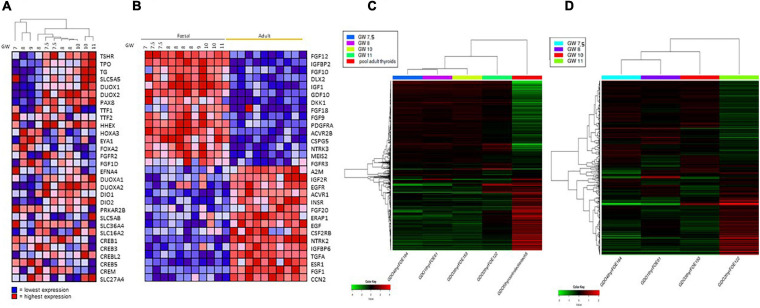
FIGURE 4.
(A) Hierarchical clustering of mRNA expression levels of thyroid function proteins in fetus samples. Hierarchical clustering and heat map of expression ratios of genes involved in thyroid function in fetal thyroids versus the pool of normal adult thyroid samples (CLONTECH). For each gene (row), the expression ratio ranges between lowest in dark blue to highest in dark red. (B) Heat Map: expression of growth factors and receptor signaling proteins in fetal and adults thyroids. For each gene (row), the expression ratio ranges between lowest in dark blue to highest in dark red. GW, gestational week. (C) Hierarchical clustering of the RNAseq expression data of the 2000 most variable genes in four fetus thyroid samples ranging from GW 7.5 to GW 11, and in one adult thyroid sample. Hierarchical clustering and heat map of expression (in CPM -Counts Per Million-) of the 2000 most variable genes in fetal thyroids (GW: 7.5, 8, 10, 11) versus the pool of normal adult thyroid samples (CLONTECH). For each gene (row), the expression ratio ranges between lowest in dark green to highest in dark red. (D) Hierarchical clustering of the RNAseq expression data of the 2000 most variable genes in four fetus thyroid samples ranging from GW 7.5 to GW 11. Hierarchical clustering and heat map of expression (in CPM -Counts Per Million-) of the 2000 most variable genes in fetal thyroids (GW: 7.5, 8, 10, 11). For each gene the expression ratio ranges between lowest in dark green to highest in dark red.

