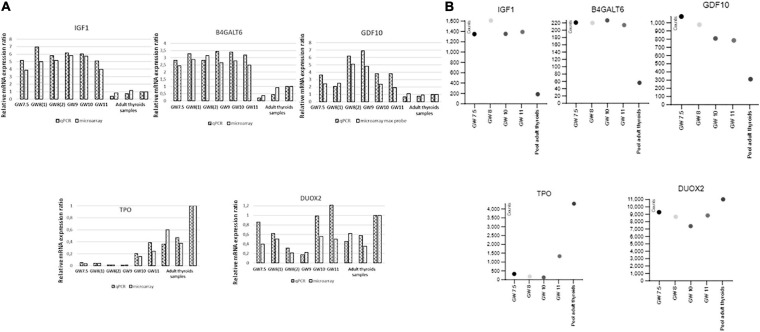
FIGURE 5.
(A) Validation by qRT-PCR of the microarray data for IGF1, GDF10, B4GALT6, TPO, and DUOX 2. Ratios of gene expression in qRT-PCR and microarray experiments for different embryonic thyroid samples compared to a pool of adult thyroids (Clontech). Samples are labeled as in Supplementary Table 1: GW 7.5: ET2, GW 8(1): ET4, GW 8(2): ET6, GW 9: ET8, GW 10: ET9, GW 11: ET11 adult thyroid samples: BO148N BO147N and CLONT (GW: gestational week). (B) Validation by RNAseq of the microarray data for IGSF1, FGF 12, TSHR, DUOX, and SLCA5A. Expression of genes in counts (counts per 20 million of reads) from RNAseq experiments performed on four fetal thyroid samples and on the pool of adult thyroids (Clontech), labeled as in Supplementary Table 1: GW 7.5: ET 3, GW 8: ET 5, GW 10: ET 10, GW 11: ET 11 (GW: gestational week).

