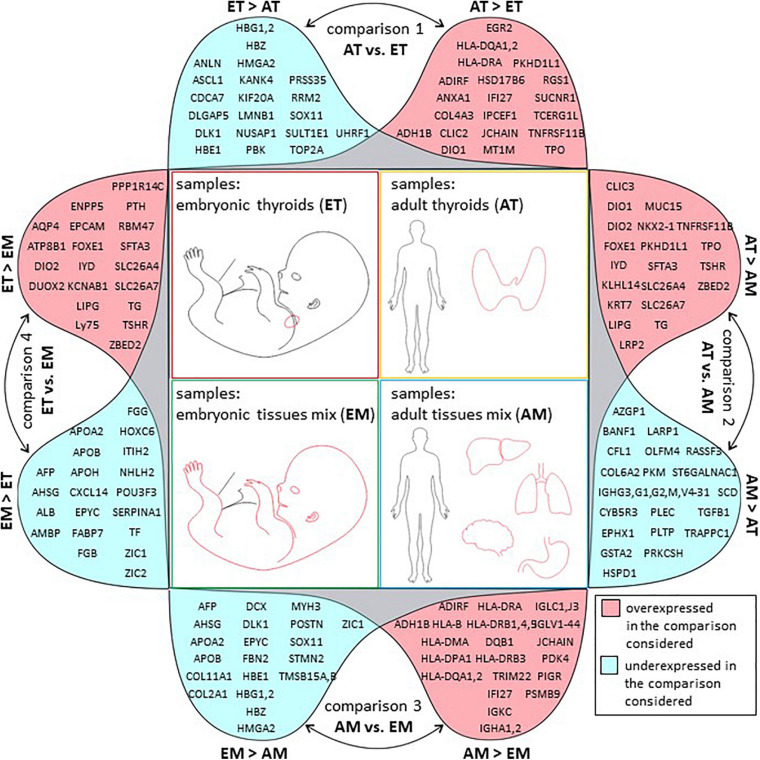
FIGURE 6.
Top 20 regulated genes in all comparisons. Graphical representation of tables of top 20 protein-coding genes with strongest up (in pink) or downregulation (in blue) in each of the four comparisons of transcriptome datasets described in this study. Comparison 1: transcriptomes of adult thyroids (AT) and embryonic thyroids (ET), comparison 2: transcriptomes of adult thyroids (AT) and adult tissues mix (AM), comparison 3: transcriptomes of adult tissues mix (AM) and embryonic tissues mix (EM), comparison 4: transcriptomes of embryonic thyroids (ET) and embryonic tissues mix (EM).

