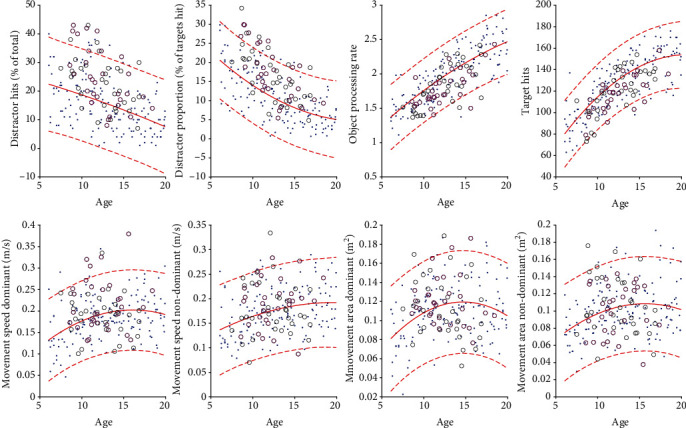
Figure 3.

Performance on different task parameters as a function of age, comparing patients (those without comorbid ADHD with those with comorbid ADHD) with controls. In each plot, dots represent controls, black circles represent patients without comorbid ADHD, and magenta circles represent patients with comorbid ADHD. Age curves are shown as solid traces, with 95% prediction bands shown as dotted traces.
