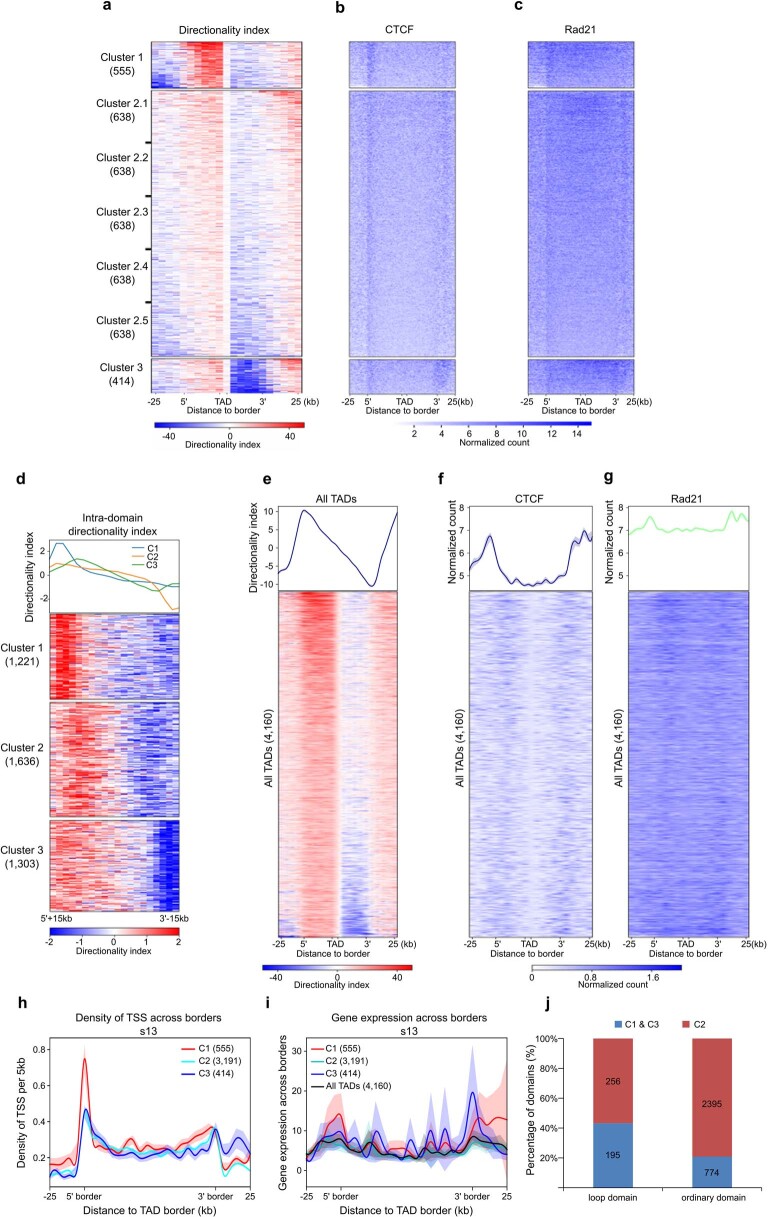
Extended Data Fig. 5. Orientation-biased CTCF and Rad21 enrichment at TAD borders of higher directionality index values.
a, TADs of stage 13 embryos clustered on directionality index. Cluster 2 is further divided into five sub-clusters with an equal number of TADs. b, CTCF ChIP-seq signal across TAD borders in each cluster. c, Rad21 ChIP-seq signal across TAD borders in each cluster. d, Intra-domain directionality index was calculated and was used to cluster TADs into three groups. There are 1,221, 1,636 and 1,303 TADs in clusters 1, 2 and 3, respectively. Note the low DI values on the y-axis. e, Average directionality index across borders of all TADs without clustering. TADs are arranged with DI of decreasing absolute value on the 5′ border and DI of increasing absolute value on the 3′ border. f, Relative enrichment of CTCF across borders of all TADs showing indistinguishable differences in signal strength at borders on both sides of TADs. g, Relative enrichment of Rad21 across borders of all TAD showing indistinguishable differences in signal strength at borders on both sides of TADs. Data in e, f, and g are represented as mean±SEM. h, Density of TSS across three clusters of TAD borders. i, RNA level across the borders of three clusters of TADs. Data in h and i are represented as mean±SEM. j, Percentage of loops and ordinary domains in clusters 1&3 and cluster 2.

