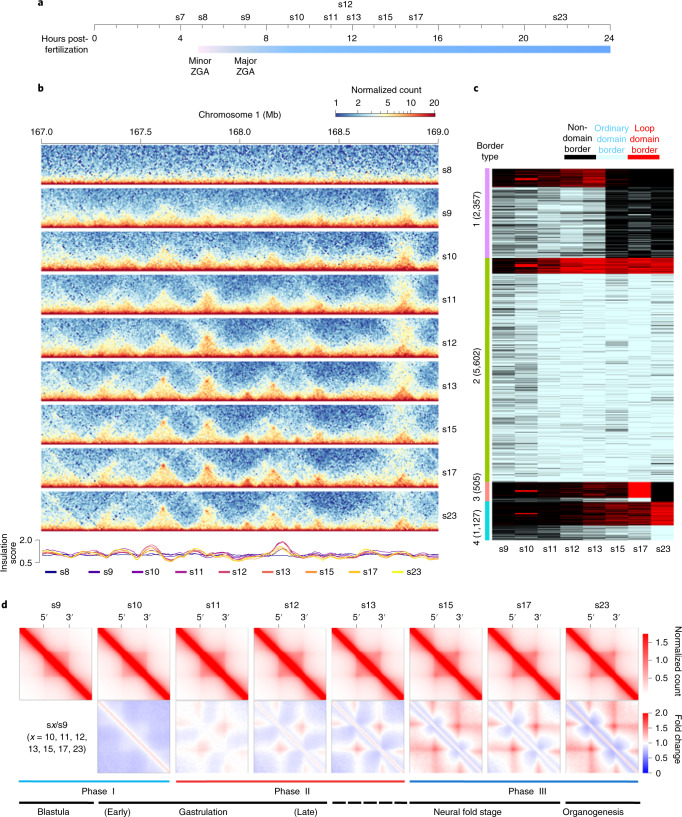
Fig. 2. De novo TAD establishment during embryogenesis of X. tropicalis.
a, Schematic representation of the ten developmental stages examined by in situ Hi-C. b, Chromatin interaction frequency mapped at a 5-kb resolution. c, Clusters of TAD borders appear for ordinary domains (light blue), loop domains (red) and non-domains (black) at each specific developmental stage. ‘Non-domain border’ refers to a genomic region not identified as a TAD border at a specific embryonic developmental stage, which switches to a TAD border at other development stages. d, Heatmaps of aggregated TADs for the eight developmental stages. The interaction frequency of aggregated TADs from s10 to s23 was normalized against s9. Three phases of change in the TAD structure are shown below, with the developmental stages also shown (TAD number at s9, s10, s11, s12, s13, s15, s17 and s23: 2,471, 2,805, 3,599, 4,036, 4,160, 3,164, 3,609 and 3,199).

