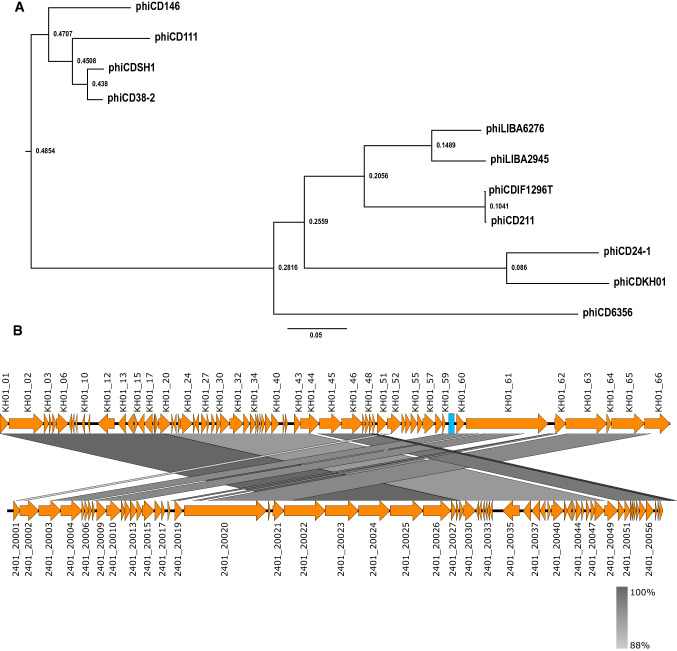
Fig. 2.
a Comparative phylogenetic analysis base on complete genome sequences of C. difficile siphoviruses available in the GenBank database. The figure represents the guide tree calculated using the progressive Mauve algorithm. Numbers associated with each branch represent node ages. b Comparison of the genome sequence of phage phiCDKH01 (top) with phiCD24-1 (bottom). Predicted ORFs and the direction of transcription are indicated by block arrows. The blue box represents a putative CRISPR element. Conserved regions are shaded in grey. The colour intensity corresponds to sequence identity level (89% to 100%). Genomic comparisons were performed using BLASTn. Similarities with E values lower than 1e-100 are plotted. The figure was produced using Easyfig 2.2.5 [26].

