Fig. 5.
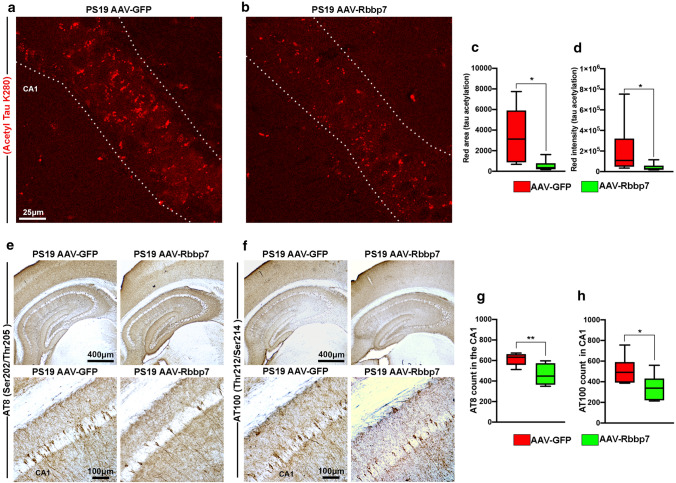
AAV-Rbbp7 reduces tau acetylation and phosphorylation in PS19 mice. a, b High magnification representative photomicrographs of hippocampal sections stained for Acetyl Tau K280. Dotted lines depict CA1 area analyzed. c, d Quantitative analysis of Acetyl Tau K280 area and intensity in CA1 of the hippocampus. e, f Low and high magnification representative photomicrographs of hippocampal sections stained for AT8 and AT100. g Quantitative analysis of AT8 + cell count in CA1 of the hippocampus. h Quantitative analysis of AT100 + cell count in CA1 of the hippocampus. Box plots: center line represents the median, the limits represent the 25th and 75th percentile, and the whiskers represent the minimum and maximum values of the distribution. *p < 0.05; **p < 0.01

