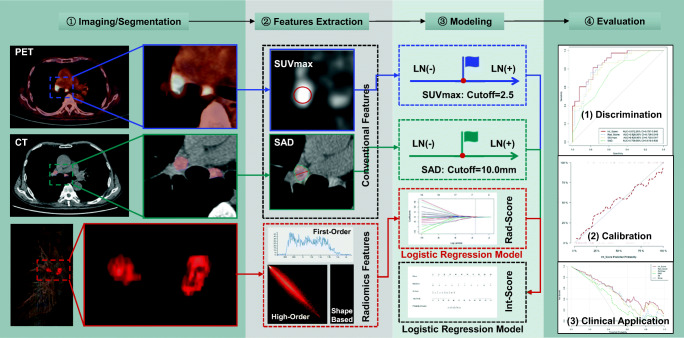
Fig. 1.
Workflow diagram of the study. In the first row, the blue solid border figures represent the SUVmax of LNs measured on PET image; the blue dashed border plot represents SUVmax single factor prediction model established with a cutoff value of 2.5. In the second row, the green solid border figures represent the short-axis diameter (SAD) of LNs measured on CT image; the green dashed border plot represents the SAD single-factor prediction model established with a cutoff value 10.00 mm. In the third row, the red solid border figures represent that VOIs segmented based on LNs; the red dashed border plot at the bottom the second column represents the radiomic features of LNs including first-order, shape, and high-order features, and the red dashed border plot in the third column represents the radiomics model (Rad-Score) built by LN status-related radiomics features using multivariable logistic regression analysis. The black dashed border plot at the bottom of the third column represents the PET/CT nomogram (Int-Score) incorporated SUVmax and Rad-Score by multi-variable logistic regression analysis. In the last column, these three plots represent the receiver operating characteristic (ROC) curves, calibration curves, and decision curve analysis (DCA) curves in the testing cohort in order from top to bottom

