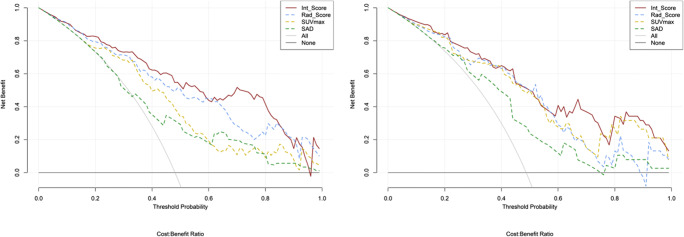
Fig. 3.
DCA for SUVmax, SAD, Rad-Score, and Int-Score in training (left) and testing (right) cohorts. The y-axis measures the net benefit. The y-axis measures the threshold probability. The solid red curve represents Int-Score. The blue dotted curve represents Rad-score. The yellow dotted curve represents SUVmax. The green dotted curve represents a short-axis diameter (SAD). The gray curve represents the assumption that all LN metastases. The black line represents the assumption that no LN metastases. The net benefit [40] was calculated by subtracting the proportion of all LNs, which are false positive from the proportion which is true positive, weighting by the relative harm of forgoing treatment compared with the negative consequences of unnecessary treatment

