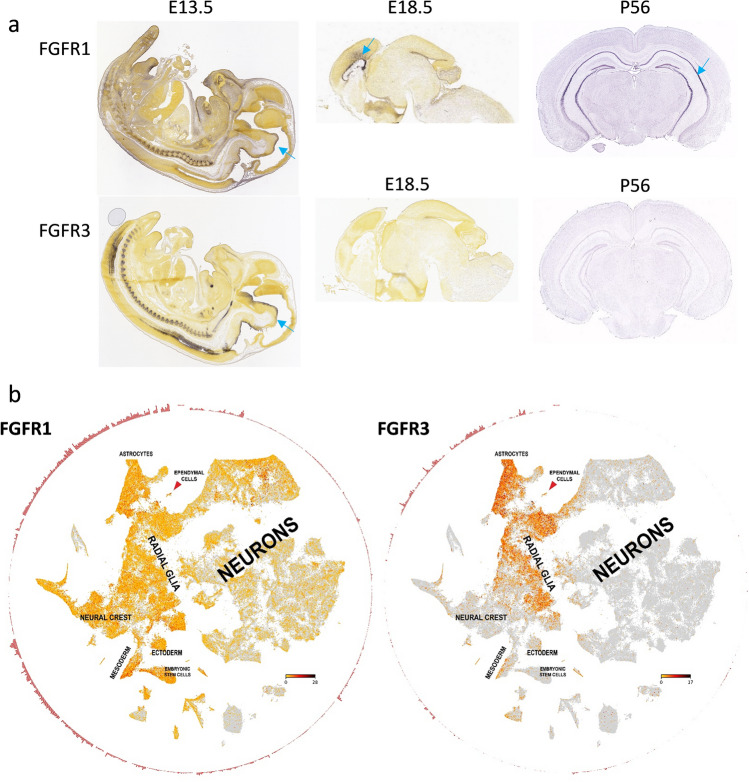
Fig. 2.
FGFR expression of cell populations during brain development. a Expression of FGFR1 and FGFR3 mRNA in diverse stages of mouse brain development as indicated. In situ hybridization data was derived from the Allen Developing Mouse Brain Atlas (Copyright Allen Institute for Brain Science, http://developingmouse.brain-map.org). Blue arrows indicate the subventricular zone. b Single-cell mRNA expression of FGFR1 and FGFR3 in diverse cell populations within the developing mouse brain. Data was generously provided by Sten Linnarsson and adapted from www.mousebrain.org. Expression levels are indicated by color (yellow = low; red = intermediate; black = high)

