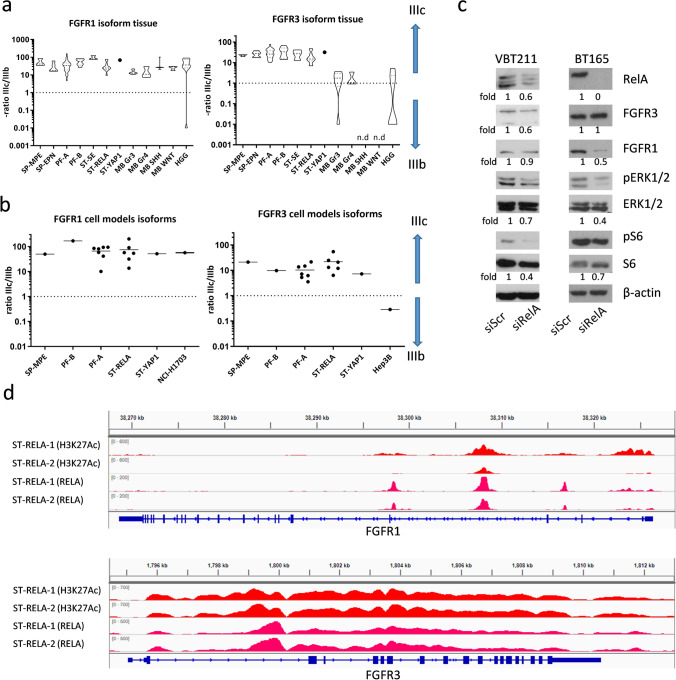
Fig. 3.
FGFR1 and FGFR3 mRNA splice variants in EPN tissue samples and cell models. FGFR1-IIIb and -IIIc as well as FGFR3-IIIb and -IIIc mRNA levels in EPN (a) tissue samples and (b) cell models were determined by qRT-PCR, normalized to the housekeeping gene β-actin (ΔCT), converted to a linear form using 2−ΔCT and were finally expressed as ratios IIIc/IIIb. FGFR-positive controls (NCI-H1703 and Hep3B) are included. The cohort comprises myxopapillary ependymoma (SP-MPE), spinal ependymoma WHO grade II (SP-EPN), posterior fossa group A (PF-A) and B (PF-B), supratentorial subependymoma (ST-SE), RelA fusion-positive (ST-RELA), and Yap1 fusion-positive (ST-YAP1) ependymomas, medulloblastoma group 3 (MB G3), group 4 (MB G4), sonic hedgehog-activated (MB SHH), wingless-activated (MB WNT), and high-grade glioma (HGG). c Immunoblots depict protein expression and phosphorylation levels 72 h post transfection of the ST-RELA cell models VBT211 and BT165 with siRELA or non-targeting siRNA (siScr). Fold changes of the indicated proteins are given relative to respective siScr controls. d Red and pink peaks represent chromatin immunoprecipitation (ChIP) sequencing read coverage for the activating histone mark H3K27-acetyl (H3K27Ac) and RELA, respectively, at FGFR1 and FGFR3 gene loci. Sequencing reads of two ST-RELA tissue samples (ST-RELA-1 and ST-RELA-2) were mapped to hg19 human genome and visualized utilizing an integrative genome viewer

