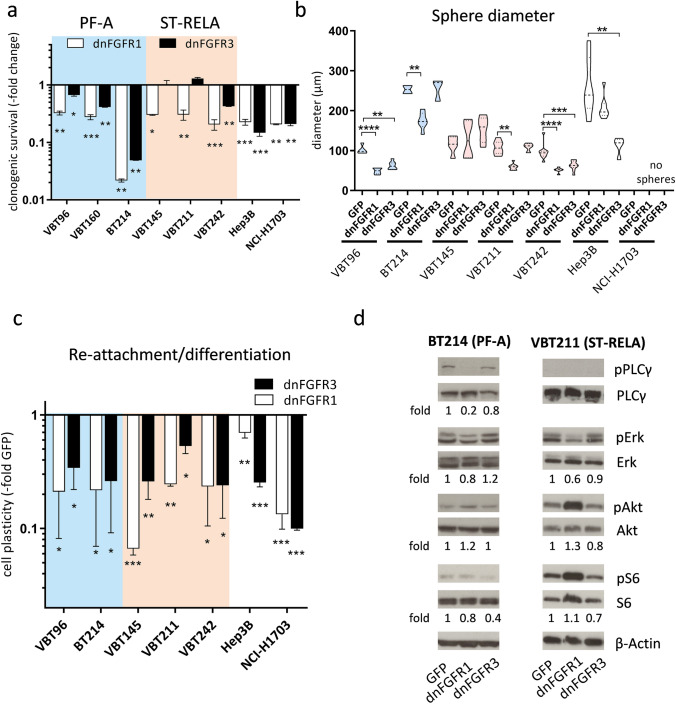
Fig. 4.
Transduction with dominant-negative (dn) FGFR1 or dnFGFR3 impairs clonogenicity, stem cell capacity and FGFR-downstream signaling cascades. a Bar graphs depict fold changes of clonogenic survival upon expression of dnFGFR1 or dnFGFR3 in comparison to GFP-vector controls (set as 1) in the indicated PF-A (blue; n = 3) and ST-RELA (pink; n = 3) cell models. Cells were seeded at low density, infected with the indicated adenoviral constructs and followed for 14 days. Hep3B and NCI-H1703 served as positive controls. b Sphere diameters (in µM) of PF-A (n = 2), ST-RELA (n = 3) and FGFR-positive control cells expressing either GFP-empty vectors, dnFGFR1 or dnFGFR3 are given. Experiments were performed in duplicates and statistical differences between GFP-controls and dnFGFR1 or dnFGFR3 were determined by one-way ANOVA with Tukey correction for multiple comparison. c six days after transduction of the indicated adenoviral constructs (compare b), spheres were seeded back in medium containing FCS and the capacity to attach and re-grow was followed. Results are presented as mean ± SD in comparison to respective GFP-vector controls, set as 1. Statistical power was calculated using one-way ANOVA with Tukey correction for multiple comparison. d Western blot analyses of the PF-A, BT214 and ST-RELA, VBT211, cell models upon expression of dnFGFR1 and dnFGFR3. Total protein expression and phosphorylation levels of the indicated PLC-γ (PLCγ, pPLCγ), MAPK (ERK, pERK) and PI3K (Akt, pAkt, S6, pS6) pathway mediators are depicted. ß-actin served as a loading control. Fold changes of the indicated proteins are given relative to respective GFP-transduced controls. ****p < 0.0001, ***p < 0.001, **p < 0.01, *p < 0.05

