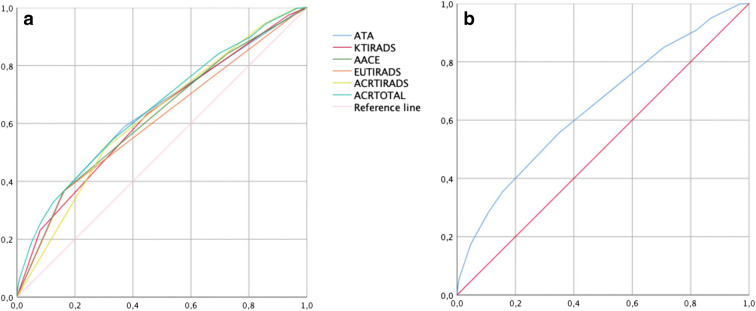
Fig. 2.
a ROC curves according to positive cytology for all NUS scores. The area under ROC curves are 0.623 (CI 95%; 0.599–0.647) for KTIRADS; 0.632 (CI 95%; range 0.608–0.656) for ATA; 0.623 (CI 95%; 0.599–0.646) for AACE/ACE-AME; 0.606 (CI 95%; 0.582–0.631) for EUTIRADS; 0.622 (CI 95%; 0.600–0.645) for ACRTIRADS range 1–5. b ROC curve considering the total scoring of ACRTIRADS (points 1–14). The area under ROC curve is 0.647 (CI 95%; 0.625–0.669)

