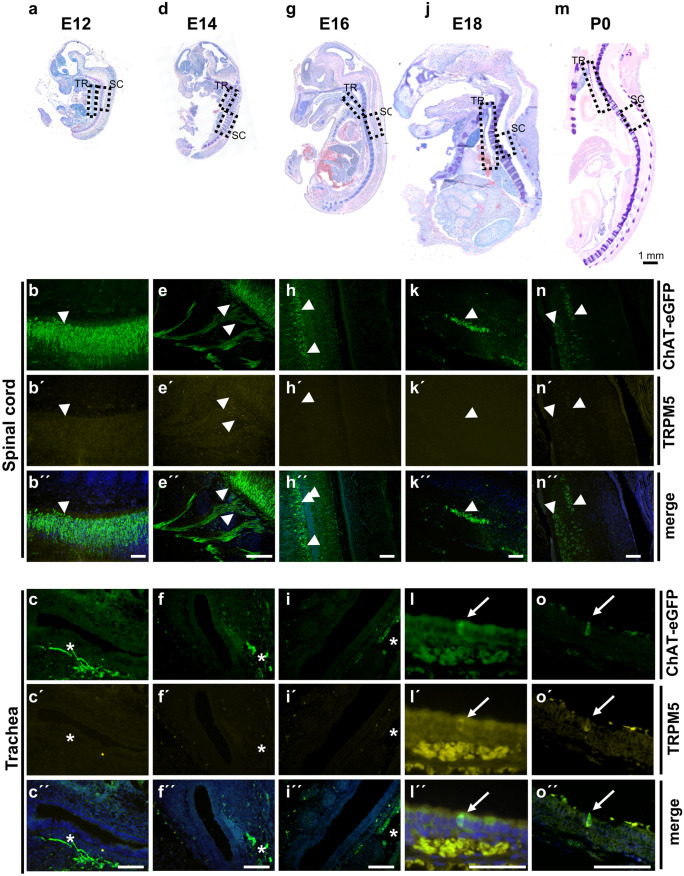
Fig. 2.
Prenatal and perinatal development of tracheal CCC. Giemsa-stained paraffin sections from ChAT-eGFP mice (von Engelhardt et al. 2007) at distinct developmental stages with corresponding immunofluorescence images of trachea and spinal cord a–c E12 (N = 4), d–f E14 (N = 5), g–i E16 (N = 8), (j–l) E18 (N = 6), and (m–o) P0 (N = 3). Dashed boxes highlight locations where according immunofluorescence images of trachea (TR; b, e, h, k, and n) and spinal cord (SC; c, f, i, l, and o) were
taken from adjacent sections double-labeled for TRPM5 and GFP; arrows mark ChAT-eGFP- and TRPM5-positive tracheal CCC at E18 and P0; arrowheads mark ChAT-eGFP-positive neurons; asterisks mark ChAT-eGFP-positive nerve fibers below the tracheal epithelium. Scale bar depicts 100 µm in the immunofluorescence images and 1 mm in Giemsa-stained overview images

