Fig. 6.

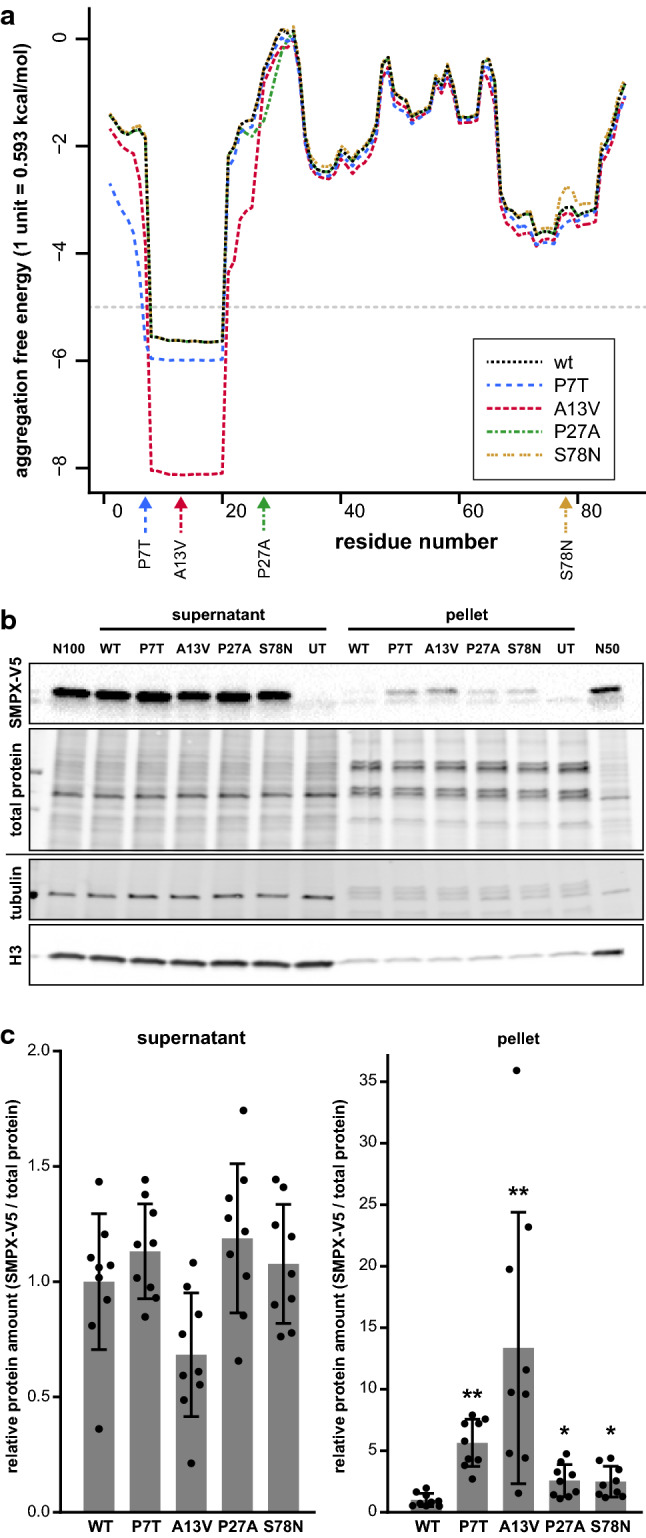
Aggregation propensity of mutant SMPX a In Pasta2.0 prediction, an N-terminal region of wild-type SMPX showed aggregation propensity, which was further enhanced by the p.P7T and p.A13V mutations, as indicated by the decrease in free energy. The gray dashed line shows the aggregation threshold of 5 PASTA units. b Representative fractionation experiment demonstrating reduced solubility of mutant SMPX-V5. Total protein staining of the V5 blot, and tubulin and histone 3 (H3) stainings of a separate blot are shown as loading and fractionation controls. UT, untransfected; N100 and N50, normalization samples. (c) Quantification of SMPX-V5 in supernatant and pellet fractions. The graph shows mean ± SD from three triplicate experiments (n = 9), normalized to total protein loading and to the mean of wild-type SMPX within each experiment. Asterisks indicate significant differences compared to WT (two-tailed Mann–Whitney U test with Bonferroni correction; * p < 0.05; ** p < 0.01)
