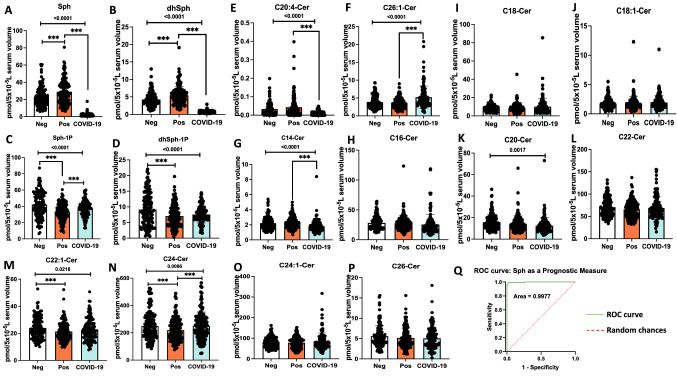
Figure 1.
Decreased serum sphingosine level is linked with COVID-19 symptoms. Lipidomics measurements based on High-Performance Liquid Chromatography-tandem Mass Spectrometry (LC–MS/MS) for (A) Sphingosine (Sph), (B) dihydro-sphingosine (dhSph), (C) sphingosine 1-phosphate (Sph-1p), and (D) dihydro-sphingosine 1-phosphate (dhSph-1p). LC–MS/MS ceramide (Cer) measurements for (E) C20:4-Cer, and (F) C26:1 Cer. Moreover, LC–MS/MS ceramide (Cer) measurements for (G) C14-Cer, (H) C16-Cer, (I) C18-Cer, (J) C18:1-Cer, (K) C20-Cer, (L) C22-Cer, (M) C22:1-Cer, (N) C24-Cer, (O) C24:1-Cer, and (P) C26-Cer. (Q) Graphical ROC (receiving-operating characteristics) curve for Sph as a prognostic measure, produced by plotting Sensitivity(true positive rate) against 1-Specificity (false positive rate). Area under the ROC curve is 0.9977 or 99.77%. The light green line (ROC curve) shows combinations of sensitivity and specificity for threshold values, while the red dotted line (Random chances) indicates a reference cut-off point for a useful model. Neg negative antibody test (n = 130), Pos asymptomatic positive antibody test (n = 134), COVID-19 symptomatic patients (n = 131). Data are means of ± SEM, and P < 0.05 is considered significant. Comparisons significant at the 0.05 level are indicated by ***.

