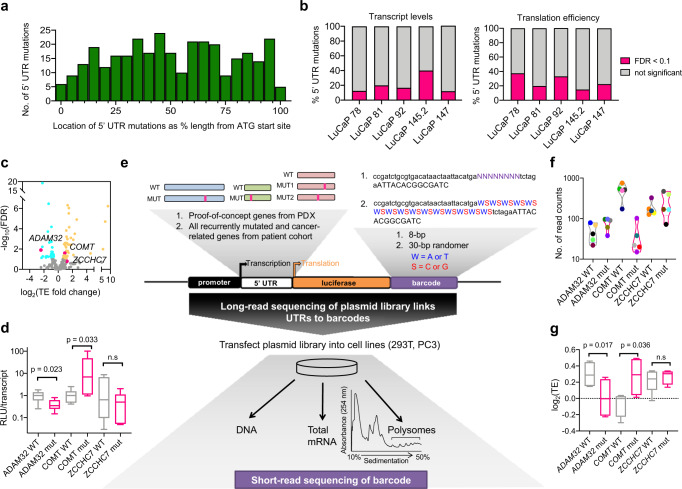
Fig. 1. Development of a massively parallel reporter assay to quantify the impact of 5′-UTR mutations on transcript levels and mRNA translation.
a Histogram of the genomic distribution of all somatic single-nucleotide 5′-UTR mutations in five prostate cancer patient-derived xenografts (PDX) from the LuCaP series. b Percentage of 5′-UTR mutations in each LuCaP PDX that significantly alter transcript or mRNA translation efficiency (TE) levels (FDR < 0.1, represented in pink). Across five xenografts representing a spectrum of advanced human prostate cancer (adenocarcinoma, neuroendocrine prostate cancer, hypermutated prostate cancer), 13 mutations exhibited a decrease in transcript levels, while 35 mutations exhibited an increase. At the level of translation, 31 5′-UTR mutations decreased ribosome occupancy (decreased translation efficiency [TE]), while 42 had the opposite effect, independent of changes at the mRNA level. c Volcano plot showing TE fold changes of all 5′-UTR mutations in these LuCaP PDXs. Each dot represents TE fold change of a 5′-UTR mutation; turquoise dots are 5′-UTR mutations that significantly downregulate TE of its specific mRNA (FDR < 0.1), yellow dots are 5′-UTR mutations that significantly upregulate TE of its specific mRNA (FDR < 0.1). Thirty-one 5′-UTR mutations decreased ribosome occupancy (decreased translation efficiency [TE]), while 42 mutations increased TE. Mutations selected for orthogonal validation are demarcated in pink and labeled with the gene name. d Luciferase assays validating potentially functional 5′-UTR mutations (pink) identified by ribosome profiling including ADAM32 (chr8: 38965236, C -> T) and COMT (chr22: 19939057, G -> A), as well as the negative control ZCCHC7 (chr9: 37120713, C -> T). Normalization was performed by taking the ratio of the relative luminescence unit (RLU) to the amount of luciferase transcript determined by qPCR (n = 4–8 biological replicates, one-sided Student’s t test). Data are presented as median by the center line, and the first and third quartiles as the upper and lower edges of the box. All minimum and maximum data points are indicated by error bars. e Simplified schematic of the Pooled full-length UTR Multiplex Assay on Gene Expression (PLUMAGE). f All 30 unique 8-bp barcodes were detected and linked with their respective WT and mutant 5′-UTR by PacBio long-read sequencing (average of 39.4–254.2 read counts per 5′-UTR–barcode pair). Each colored circle represents a unique 8-bp barcode. Data are presented as median by the center line. g Comparison of mRNA translation efficiency between WT and mutant ADAM32, COMT, and ZCCHC7 5′-UTRs by PLUMAGE. Mutations are represented in pink. Results are concordant with ribosome profiling and luciferase assay findings in (c, d). Normalized polysome read counts for each barcode per construct were taken as a ratio over normalized total RNA read counts for the same barcode (n = 4–5 biological replicates, one-sided Student’s t test). Data are presented as median by the center line, and the first and third quartiles as the upper and lower edges of the box. All minimum and maximum data points are indicated by error bars. n.s. not statistically significant. Source data are provided as a Source data file.

