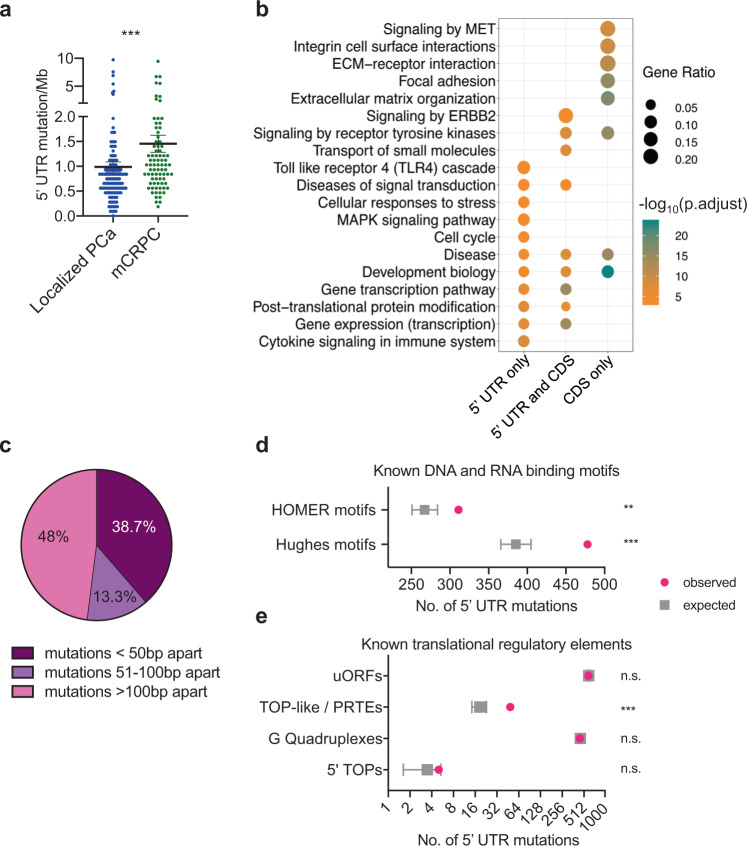
Fig. 2. The mutational landscape of prostate cancer 5′-UTRs.
a Comparison of 5′-UTR mutation rate (5′-UTR mutation/Mb) in localized prostate cancer (PCa) patients (n = 149, each patient represented by a blue dot) and metastatic castration-resistant prostate cancer (mCRPC) patients (n = 80, each patient represented by a green dot). Each dot represents the mutation rate per patient (***p = 0.0001, two-tailed Mann–Whitney U test). Data are presented as mean values ± s.e.m. b KEGG and Reactome pathway analyses of all genes with 5′-UTR and protein-coding sequence (CDS) mutations across 229 prostate cancer patients. Genes with 5′-UTR mutations can cluster with or independent of genes with CDS mutations (Fisher’s hypergeometric test, FDR < 0.05). c The absolute genomic distance of somatic single-nucleotide 5′-UTR mutations within recurrently mutated genes; 38.7% of recurrently mutated 5′-UTRs have alterations located less than 50-bp apart. d Predicted enrichment of observed 5′-UTR mutations in our patient cohort across known DNA- and RNA-binding regulatory elements. Validated DNA (Homer) and RNA protein-binding motifs (Hughes) were analyzed. To generate the background (null) distribution of mutations, permutations of all 5′-UTR mutation locations (n = 2200 mutations) found in our dataset were performed ~10,000 times taking into account covariates such as trinucleotide context. The total number of observed mutations (represented by pink dots) impacting each regulatory element type was compared to the background distribution of the permutation data (represented by gray square) and the p value was computed from a distribution obtained from a Monte Carlo simulation (**p = 0.001, ***p = 0.0001). Data are presented as mean values ± s.d. e Predicted enrichment of observed 5′-UTR mutations in our patient cohort across cis-regulatory elements known to affect translation such as upstream open-reading frames (uORFs), terminal oligo pyrimidine (TOP)-like or pyrimidine-rich translational elements (PRTEs), G-quadruplexes, and 5′-TOP elements. To generate the background (null) distribution of mutations, permutations of all 5′-UTR mutation locations (n = 2200 mutations, represented by pink dots) found in our dataset were performed ~10,000 times taking into account covariates such as trinucleotide context. The total number of observed mutations impacting each regulatory element type was compared to the background distribution of the permutation data (represented by gray square) and the p value was computed from a distribution obtained from a Monte Carlo simulation (***p = 0.0001). Data are presented as mean values ± s.d. n.s. not statistically significant. Source data are provided as a Source data file.

