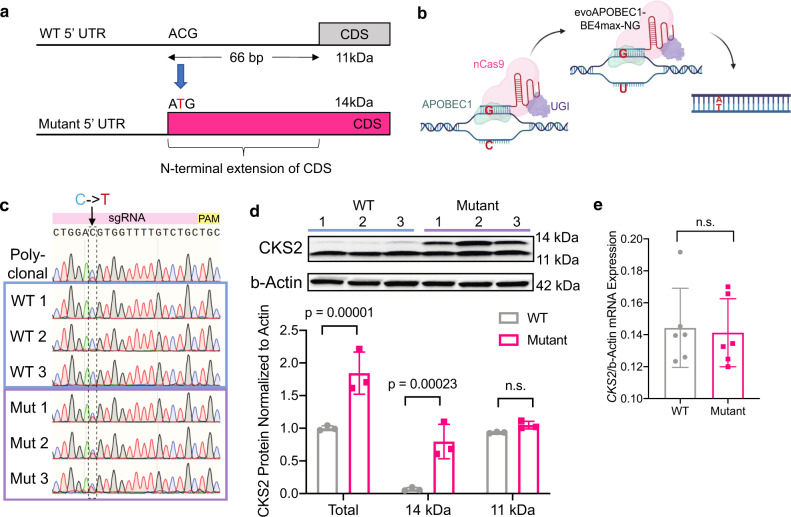
Fig. 6. CRISPR-Cas9 base editing of a point mutation in the CKS2 5′-UTR increased translation efficiency in its endogenous context.
a Schematic showing wild-type (WT, top) and mutant (bottom) versions of CKS2 transcript, including 5′-UTR, normal coding sequence (CDS), and mutant N terminally extended CDS. The C to T mutation (chr9: 91926143) within the 5′-UTR of CKS2 generates a start codon that extends the coding sequence of CKS2. The mutated nucleotide is represented in red. b Method of CRISPR-Cas9 base editing using evoAPOBEC1-BE4max-NG, which is composed of APOBEC1, a Cas9-nickase domain, and uracil-DNA glycosylase inhibitor (UGI). This base editor deaminates target cytosines to uracil, which changes the original G–C base pair into an A–T base pair after DNA repair. c Sanger sequencing traces from polyclonal population of CRISPR-transfected 293T cells and six individual single-cell clones selected from this pool for further study. The target C (blue) -> T (red) mutation in the 5′-UTR of CKS2 is shown within the dashed box. d Western blot of the three WT and three CKS2 mutant clonal cell lines created by CRISPR base editing with antibodies against CKS2 and β-actin. The graph shows these results quantified using ImageJ, where each CKS2 band intensity was measured and normalized to the intensity of the corresponding β-actin loading control. Statistics show two-sided Student’s t test with multiple comparisons correction using the three WT (gray) vs three CKS2 mutant (pink) biological replicates (total p value = 0.00001 and 14 kDa p value = 0.00023). Data are presented as mean values ± s.d. Full immunoblots are provided in the Source data file. e CKS2 qPCR shows no change in mRNA levels between three WT (represented in gray) and three mutant (represented in pink) clonal cell lines created from CRISPR base editing. CKS2 mRNA levels in each sample were normalized to β-actin as a loading control (n = 6 biological replicates). Two-sided Student’s t test, data are presented as mean values ± s.e.m. n.s. not statistically significant. Source data are provided as a Source data file.

