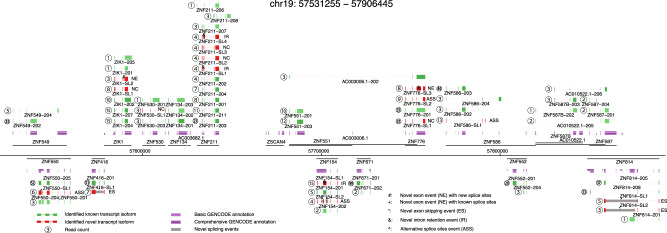
Fig. 1. Complex landscape of full-length human iPSC-CM transcriptome.
Genome-wide measurement of full-length splicing isoforms in human iPSC-CMs with a region of chromosome 19 (chr19:57531255-57906445) as an example. Gene loci are presented as a horizontal black line with annotated genes on + or – strands above or below the genome axis, respectively. Collapsed GENCODE comprehensive and basic annotation are presented in dark purple and purple track. Known transcript isoforms are shown as green tracks, and previously unidentified transcript isoforms as red. Known transcript isoforms did not pass transcript filtering criteria are presented in light green. Read counts for each identified transcript are given as number in circle. Based on the novel splicing events (location indicated with gray box and text symbols), novel transcript isoforms are categorized as novel exon combination (NC), novel exon (NE), novel intron retention (IR), novel exon skipping (ES), or novel alternative splice sites (ASS). Dubious novel read through transcripts are not shown.

